influexwp

How Subscription Companies are Losing Customers who Don’t Proactively Cancel

You may have decent metrics in place.  When people ask you what a customer is worth, you confidently say a figure.

You may even have a quick response for what the average stick rate for a customer is – “7 months,” you might utter.

“We lose about 30% in the first month, 20% of those remaining in month 2”, and so on.

Just knowing these metrics is a lot more than most folks.  (See here https://goo.gl/Pln3vU for my post about Customer LTV if you want a better understanding).

But let me ask this question – do you know what percent of those who dropped out did so proactively? Because the answer is NOT 100%.

In fact, depending on your business, it could range from 60% to 95%.  Which is a MONSTROUS range.  Said a different way, 5% to 40% of those people who dropped off as paying customers didn’t take a proactive step to do so.

Which begs the question, “What happened to them?”

One of the primary reasons that customers who didn’t want to cancel got cancelled was that their credit card didn’t process.

Yup. That annoying part of the business. The one you can never get a straight answer about. The one whose fees range from 2% of revenues into the double digits depending on your business’ risk profile.  Because remember, it’s not just processing fees; it’s chargebacks, refunds, and a bunch of other little line items that add up.

Merchant processing is the bane of many a marketer’s existence.  Sure, there are more partner options than ever before – Paypal, Stripe, Amazon, not to mention the “traditional” folks like auth.net, Vantiv, EasyPay, and so on.

(A small point of clarification before we get too far – subscription is the same thing as continuity, auto-ship, auto-renewal, or any other label where customers are billed on a recurring basis. I’m just using the term “subscription” for simplicity here.)

Insufficient funds, wrong expiration date, and reported lost card are some of the top reasons why credit cards decline on recurring billings.  Oftentimes, these customers would like to continue being customers.  But unless you are a utility or Amazon or Netflix (I’d argue that those latter two might now be considered the former), customers can be lazy, forgetful, or just too busy in taking steps to make sure their subscription stays active.

The next question is, what are you, as the marketer, doing about it?

Let’s get some grounding first.

If you’ve got some sort of subscription business, hopefully you have a version of the report below – where you are tracking customers by cohort.  In the below table, it’s by month, but it could also be by traffic channel, offer, etc.   And really the goal is to measure how long people stick around at each rebilling period.

Notice that the report is broken down by cycle (which is the frequency you bill – monthly, quarterly, annually, etc.); by gross vs. net (of returns); and by units vs. dollars in the top and bottom sections.  Each of these sections have value, and it’s important to look at your metrics in a couple different ways.

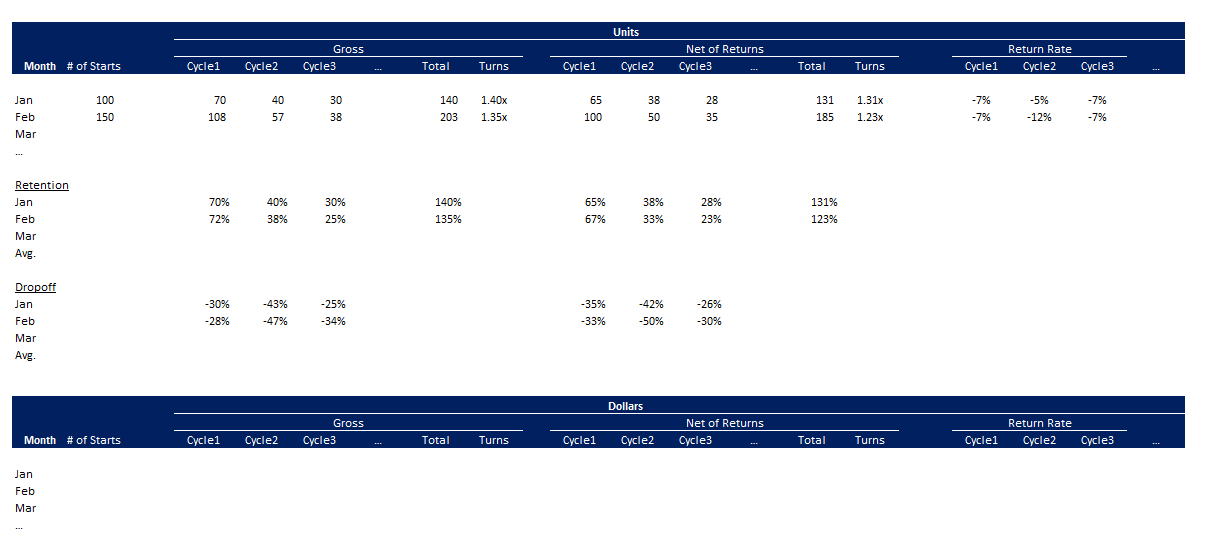
One of the ultimate goals is to know for every person who begins, how many total billings do you get from them.  In the above case, this might be a free trial offer that rolls into a paid subscription.  We want to track how many people bill in Cycle 1, 2, etc., and then roll that up to what I refer to as “Turns”.  Obviously, we lose people each month.  Tracking those people and laying out as in the table above, helps us to see exactly how many.

For the month of January, there’s a value of 1.4x in the Gross section.  Which means that for every person who starts their subscription, on average, we bill them 1.4 times.  And then because of returns, we net out at 1.31 times.

How far you carry out this analysis out depends on a few factors – how much info you actually have (# of cohorts and over what period of time), the risk you can tolerate when there’s a good amount of revenue generated in later months (and clearly later months is subjective based on your business and risk).

You can see that there are then calc’s on the percent of people who are still around (simply how many people billed relative to the # of starts) – this is labelled as “Retention,” again both calc’ed for net and gross.  The “Dropoff” section is what it sounds like – what percent of the people who were still around dropped off for the next cycle.

Whether you have a lot of volume or a small amount, if you’re running a version of a subscription model, this is a crucial bit of analyses to have.  To begin with, you need to know your numbers and this is one of the best ways I know of to understand what’s happening, at least from a purely quantitative side.  It can provide a sense of how long people are sticking around, when more people are dropping off, what types of refunds people are asking for, etc.

Depending on how you allow/ask people to cancel, you should try to marry this data alongside “reasons for cancelling”.  The info won’t be perfect – call center agents may make mistakes or customers may not click on the right button, but you should get some directional info on why people are cancelling. The most common reasons are things like, “too expensive”, “not using it”, “found something better”, “don’t have the time,” etc.  Now, if you start to see a whole lot of “your product stinks”, “it doesn’t work as you described”, etc., then there might be something you need to address with the marketing, the product, the onboarding, or something else.

Once you have all this info, then it’s a matter of figuring out if something’s broken and where the key levers in the business are.  That analysis leads to action (translation: testing) or fixing something that might be broken (don’t worry, you’re not the only one who has things break…).

The Part Many People Miss

So, you may have the raw reporting and analytics in place and you might have the reasons for why people cancel, but do you know how many people intentionally cancelled versus how many people actually dropped off?

These are “Unintended Cancels.”  People who did not take a specific action to cancel, but you are no longer billing them.

So, what to do here?

Some ecommerce systems might provide you reporting on credit card processing issues, but assuming yours doesn’t, it’s time for some forensics.

The first place I’d start is with your merchant account, which, depending on the size of your org, might mean you need to pull in help from accounting or finance.  Or it might mean you need to dig out that login info and do it yourself.  Obviously, different merchant processing platforms have different levels of reporting.  And how easy or not it is to know which declined orders are for your continuity, you try to dig in to see what is happening.  You might have SKU-level info in there or you might have to use price point, for example.

All this to say, get to the bottom of what’s happening with your credit card declines.

What are the reason codes associated with those declines?

And then what are you doing about it?

Which should then lead to a combination of both a retry process as well as a dunning process.

The Retry Process

This could be manual or automated.  But the point is that you are trying to charge a credit card where you received an error code.  I get tired of saying this, but different platforms have different levels of reporting.  Ideally, you’re only retrying those cards where you have a chance of success.  For example, if you received an error code associated with a lost or reportedly fraudulent card, you have a 0% chance of success.  It makes no sense to retry that card.

The vast majority of decline reasons are associated with insufficient funds. Whether it’s a $9.99 charge or $999 charge, a lot of customers’ cards decline for insufficient funds (which is why 1-pay or annual contracts have value – but I digress).  There are a host of other reasons: expired credit card (more below), need to call the bank for some reason, etc.

The strategy you employ to retry cards depends on multiple factors, such as the fee you pay to attempt a charge, the margin your business nets on a success transaction, and your tech/merchant processor’s tech capabilities.  You may want to retry the card every week for 4 weeks, you might want to retry on Fridays, which is payday for many people.  Or you might have another strategy that you test into.

Here’s a link to a great write-up of an automated retry process – https://docs.recurly.com/docs/dunning-management – note that recurly is a vendor that I’ve heard some folks work with. I don’t have first-hand experience.  But at the least, the info in that article is helpful and can provide a sense of the different ways you can approach the retry process and how you can use segmentation to try different strategies.

(I also want to make something very clear – as with all things, if your marketing is deceptive or if your product truly stinks, any strategy can be used for “evil” purposes.  But I’m assuming your customers like your service, they know what they are getting, etc. – and the fact that they don’t reach out to fix a declined card can be as much the busy-ness we are all a part of as opposed to their not wanting the product.  That’s why I have no problem describing these methods. I believe in integrity and ethics. And believe that if customers want to cancel, you should allow them to do so without jumping through massive hoops.)

Presumably, you’ll test a few different strategies, do the math on costs vs. the additional margin (not simply revenues) you make, and find something that works. Even if you can’t figure out an automated way when you first start this process, find a way to do it manually.  Remember, these are customers that you’ve paid for who have stopped billing.  These are real margin dollars.

By the way, you can also communicate with the customer directly.  Which leads to the next section.

Dunning Process

This is basically another way of saying, “reach out to your customers proactively to fix the situation.”

The tactics you use to do so can include email, phone calls, FB messenger, or whatever other ways you have approval to reach out to people.  Let them know their card has declined and that access to your product or service is going to end unless they fix it.  Whether they can fix it online or they need to call a customer service rep, it’s always best to give people options so they can choose the way they’d prefer.  It goes without saying but particularly when it comes to credit card info, it’s always important to stress that you know and follow the rules on how you collect and store credit card information.

Test and do the math to figure out what works (translation: where you are ROI positive).

Account Updater

I referenced expiration date issues above.  And Account Updater is something I’ve discussed previously and falls under the retry process, whether automated or manual, above.  The short version is that some banks provide a paid service to update the expiration date of a valid card but one that has simply gone past its expiration date.  It’s an extremely rare customer that will call to update their expiration date.  The beauty of the service is that you only pay per successfully-changed card.  You send the info for cards that have this expiration date issue to get the date updated.  Depending on your partner and your status, you can get charged anywhere from $0.06 to $0.18 per updated credit card.  Now, no matter your price point, that shouldn’t be that hard to ROI.

There are only certain banks that participate in this service, so it won’t be 100% of the expired cards, but this can add meaningful dollars to your bottom line.  You should reach out to your merchant processor or gateway provider to discuss how to implement this.

In Closing

Business can be tough enough as is.  But when you have paid for customers that you lose for an annoying reason like their credit card not processing, it’s that much more difficult.

Go get that margin.  And keep those customers.

Why Big Data has Become a Big Mess for Marketers

The buzz phrases sound so compelling.

Big data. Predictive analytics. Machine learning.

If you aren’t building at least one of those into your business, you’re already behind, right?

Wrong.

This isn’t to say that the concepts aren’t important. Nor that marketers should ignore them.

But the fact is that in practice, most, if not all, of them are really, really hard to execute. In addition, in trying to execute on them, key resources (time, dollars, and people, to name a few) can be drawn away from higher ROI opportunities.

The reasons for these misses can be caused by those key resources – unrealistic time expectations on how long a project can take, not enough dollars being allocated, and perhaps not having the appropriate people assigned to a task. There are plenty of other reasons – wrong strategy, bad execution, etc.

And one topic that unifies all of those above ideas is data. And typically a lot of it. You need data to make more informed and robust decisions. And then as a business grows, there’s just more data.

The problem is that most marketers don’t have great data. There’s no such thing as perfect data. Data integrity is a pain point for pretty much everyone. Which isn’t to say that you don’t work on improving it.

But capturing, aggregating, and then processing data is a lot harder than most of us would expect in 2017.

We all want data to help inform our business decisions. Okay, maybe not everyone wants it, but the idea of using data is probably something most everyone would agree is a good thing.

Getting decent data, however, even when it’s not “Big,” is shockingly difficult. Data integrity is tantamount if you’re going to use it to make better decisions. While bad info doesn’t always mean bad decisions – sure, everyone can get lucky here and there – it dramatically increases the chances of making bad decisions.

Even in the world of digital where everything is supposed to be tracked, tagged, pixeled, and so on, anyone who has run any semblance of campaigns has seen that there are always discrepancies when comparing between 2 systems.

10%-15% variances are the norm.

Think about that – that’s a good-sized difference. And when you consider that tests are sometimes called at 90% confidence, or when the differences are less than 10%, that can become problematic. (I’m oversimplifying a bit, but only by a small amount.)

Explanations of these variances can range from different methodologies, customers deleting cookies (I read one study that said up to 30% regularly delete their cookies – which I find crazy high, but still), timing differences (I love it when one system is based on eastern time and another is western time. And I still can’t remember what GMT is…).

At the same time, it can be easy to think that with big data comes better data. When you have more data, then averages and trends should appear more clearly, right? That’s part of the Law of Large Numbers.

But again, this all presume data integrity.

Which rarely happens.

And so issues are exacerbated. Not resolved.

Let me make a comparison from my crew days back in college.

Our coach constantly emphasized that if we couldn’t row well at a lower rating (strokes per minute), that we would be in worse shape at a higher rating. We discovered pretty quickly that he was right. If we weren’t in sync at a low rating, we were a thrashing mess at a higher one.

And in fact often moved the boat slower at a messy higher rating than being cleaner at a lower rating.

That same analogy applies to data. Trying to reconcile and make sense of messy and larger datasets is a total nightmare. It usually leads to massive amounts of time spent trying to reconcile what’s happening. And at worst, bad decisions. Oddly enough, these bad decisions are often worse than had you focused on more simplistic and higher level results.

To be clear, I’m not saying to ignore the data. And I’m not saying ignore how to leverage bigger data.

What I am saying is that it’s much more important to make sure your core info is in place first. That if you don’t have the simple reports, the basics, the fundamentals, in place first, then you need to focus there before going after Big Data.

Not to mention when you hear about companies doing all these things, getting featured in supposed case studies on vendor sites, etc., it can feel like you’re behind.

But take this in:
Beachbody grew to over $1 billion in revenues without a true CRM.
Dollar Shave Club, which was acquired for $1 billion, used MailChimp as one its ESP’s.

Sure, each of them might have missed out on some lost revenue and margin opportunities, but they are also proof that you don’t always need the biggest and best of tech to succeed.

My suggestion before trying to figure out how to get Big Data to work in your organization is to see if your current data is decent. That’s a low bar, but start there. And then how much is your company actually looking at and using your data. Are you leveraging analytics and insights, not just reports.

Get the basics working and the teams and processes dialed in first before going after the big and sexy tech.

From personal experience, I know it’s no fun when you don’t have a CRM. It’s no fun when people outside criticize you for what you can’t do. But I’d also say that when those critics made their comments about Beachbody, there was also a lot of envy with the size of the business.

And frankly, I felt the same way when I rowed crew. Sure, our stroke rating wasn’t as high as some other boats, and it might not have looked like we were going that fast. We didn’t win every race, but we moved our boat well enough to win a few (let’s be realistic, getting a few wins for the MIT crew team was a challenge when the Ivy League teams were recruiting). And that was better than some of our competitors who thought they were doing better with a higher stroke rating but never came out on top.

We all have to be comfortable with messiness in our lives. And in our businesses.

But if we can avoid some of those messes and get real value from the more simplistic areas of each, then isn’t that preferred over never making progress?

Low-Hanging Fruit for Subscription Box Companies

Subscription boxes tout not just convenience but customization.  Not simply making it easier for you, but actually designed for you.

Many of them use surveys as you enter the site and the sign-up process.  It’s a great way to gather information and preferences about a customer and to help inform the personalization.  Now, just how customized a box is based on the answers really varies by business, but at the least, you get the feeling that your preferences are being taken into account.

Below you can watch a video where we break down a key missed opportunity that these companies should be testing to help better convert warm leads and inactive buyers. 

Analysis of SmartyPants Vitamins’ Customer Acquisition Efforts

Without any inside info, I took a look, made some suggestions and asked some questions about ways to improve what Smartypants Vitamins is doing. I’m a fan of the brand and just wanted to put together a brief video of some thoughts on how they might be able to do things better.
Video and write-up, whichever you prefer.

http://www.roundtwopartners.com/smartypants

It’s No Wonder Your Analytics Team Isn’t Getting You What You Need

Not getting what you want

Depending on your perspective, you may or may not want to know how times you were presented with a set of analyses that could have had a meaningful impact on your business, but for one reason or another (which I’ll talk to in a moment), you didn’t realize it.

Most entrepreneurs, marketers, and business leaders whom I meet know that their metrics are crucial to their success.  In particular, they know how those metrics set benchmarks and then inform decisions for how to improve business performance.  But in talking to these same business leaders, I’ve found that most of them are frustrated by what their analytics team provides to them.

See if any of the following sound familiar from your meetings with your analytics team:

  • A brutally painful spreadsheet, printed out at 50% of normal size
  • A table that takes 15 minutes to understand
  • Some cool graphs and data points that don’t have anything actionable associated with them, but they’re really cool, aren’t they?
  • The analytics person delivering a report but having spent zero time thinking about *how* to take action on the data
  • Reports that flat out just don’t make sense because no one spent the 5 minutes looking at the data to ask if it makes sense.  Have you ever seen site conversion jump from 5% to 76% in 2 days? Yea, neither have I.  But the report you looked at last week says it did…
  • A disconnect between what you thought you asked for and what was delivered (this is certainly not exclusive to analytics)
  • How about this scenario: at the end of a metrics meeting you find yourself saying, “Here, you just aren’t getting it.  Let me draw out exactly what I’m looking for.” Then the analyst sits there somewhat shaken, pretends like they understand, doesn’t asks questions, and leaves saying something like, “Ok. I see what you’re saying. I’ll get you something right away.”  (The other two likely scenarios are that you call in the CFO to help or that the meeting ends as another is about to start with something like, “we’ll pick this up later.” 2 weeks later, it still hasn’t.)

Let me be clear about something – this is not about taking sides.  The only side I’m on is that I want businesses to leverage their information and people as much as possible.  And as I’ll get into shortly, there are ways to make significant improvements to avoiding the above scenarios.

During my first few years at Beachbody, I helped to build the strategic analysis team.  Of course I’m biased, but I think that was one of the higher-performing analytics teams in the industry.  At the same time, a good amount of that list above comes from first-hand experience, typically something that I did myself.  The rest has come from helping clients build, leverage and develop their analytics people.  And as much as I’ve grown into a broader marketer, analytics still holds a special place in my heart.

In this article, I’m intentionally going to focus on the relationship and people side of working with your analytics team.  Obviously, there are a host of issues that are crucial to getting what you want – hiring, data integrity, tools, etc.  But in my experience too often the people side of working with analytics is ignored.

First off, to those of you who think you have a one-person analytics team, that’s, well, not accurate.  That person likely works with someone in IT and also pulls data out of vendor platforms.  They may be the one you go to, but it’s important to realize that analytics is never just one person nor one department.  For simplicity’s sake here, however, I’ll be using the term “analytics team” even if that means that one person for you.

I have an entirely separate post about hiring analytics people here, but even if your team comprises “what good analytics people look like” – good at Excel (or at least says they are), something technical in their college experience, and claim to have experience in statistical tools or Google Analytics – too many marketers end up wanting more from analytics.

Are we clear on what exactly Analytics is?

Whether it’s differentiating between buzz words like BI and Big Data, or doing so with some commonly-used terms like reporting and analytics, it’s important to make sure you and your teams are aligned on what these terms mean to your organization.  You have your understanding.  Likely people have worked elsewhere, and these terms have meant something else.

If this is already starting to feel like work, I’d say that’s entirely correct (I hear this often at this point in the conversation when I’m working with clients). And just like everything else in your business, making sure you are getting what you want from your analytics team takes at least a bit, if not a lot, of work.

At the core, however, many people don’t realize just how much is involved in building a high-performing team or just haven’t put the attention and follow-up in the right places.  Hopefully this article helps in those regards.

Now, on to the real matter at hand.  It’s a rare case where the analytics team is trained, in two specific areas.

First, there often is very little training about the business as a whole. Sure, you may have an onboarding process, and perhaps you’ve even talked about your company strategy at your all-hands meetings.  But I’m referring to a more granular view of the business – what historically have been the key levers, where are the known pain points, and so on.

Too often it feels like the relationship between business leader and analytics is solely transactional. Meaning, when you ask for something, you are likely literally asking for the specific thing you want. Or at least you think you are.  No real context is provided. Then when you get something back, it’s not what you really wanted.  And you’re wondering why you have to do all the thinking about what the report you just got means.

Your people will appreciate the time you’ve taken to explain the business.  More importantly, having broader context oftentimes results in their identifying opportunities simply because their eyes were open.  It may seem like a random comparison, but I liken this to how, once you’ve just gotten a new car, you start seeing them all over the place.  When in fact they were always there.  Now, you just had a reason to actually “see” them.  Bottom line, help your people know what to look out for.

Second, it’s a rare analytics team that gets focused training on how to deliver actionable insights in a way that someone else can understand. Because isn’t that ultimately the whole point of business metrics and analytics?

Fortunately, both of these two areas can improve.  With much more on that second point below.

So what’s the solution?

Below, I address the biggest areas of unmet needs I’ve seen in organizations.  Not surprisingly, there are a combination of factors that help to set up a great relationship between you and your analytics team.  One in which you’re getting the information and insights to help move the business forward.  And one where your teams are satisfied, highly-motivated, and high-performing.

Here’s what you can do from the business side 

  1. Reporting vs. analytics

Reporting is a bunch of information put together and delivered to you, likely via email.  Analytics means taking that same information and providing real value.  It means insights and suggestions on what the data means.  This isn’t to say that your folks should necessarily come to you with new landing page designs or ways to optimize your call center scripting to improve customer satisfaction.  But it does mean to show up being able to describe what the information says and where there are areas of opportunity.  At a bare minimum, nothing you see should show up without a summary of key points.

  1. Set the bar high.  

It doesn’t matter how your company used to operate or what the norm was at a prior employer.  Demand more of your people.  Tell your people to come with ideas, implications, and next steps.  They may not be high-ROI ideas at the outset, but just like any muscle, that skill has to be nurtured.  People need to be clear about what is expected of them.  And then hold them to that.

  1. Remember, you’re typically dealing with introverts

One of the greatest challenges in effective communication between marketers and analysts stems from a difference in personality types.  Most analytics folks are introverts (whereas most marketers are the opposite), and so the analysts may take some time to process information or may feel less comfortable with conflict or challenging what you have to say. (Again, this is relevant for more than analytics people, but particularly so in my experience.)

They often struggle with knowing what the best means is to communicate findings – in person or email.  Sure, it’s on them to be proactive, but I can almost guarantee that if you ask them what they are working on today, there will likely be something that you are interested in.

  1. What motivates them

Each person has their own irrational passions (more about that in another post).  Typically, analytics folks want to be able to show what they can do and want to know that their work lead to something impactful.  They want to feel like they are a part of the team, not just some back-office Excel or data monkey (perhaps one of the pejorative terms I’ve heard them referred to).

  1. Don’t allow your analytics team to turn into a reporting one

I’ve seen far too many companies suck the life out of their analytics teams by turning them into report-pullers.  Good analysts bring you insights.  Report-pullers give you data and leave it to you to do the “real” thinking.  If you want the former, you have to guard against the latter.  That’s because it’s really easy to ask for reports from the people who bring you and others analyses.  Tools, clear roles, and an effective manager (more for the VP of Analytics later in this article) can all be components of allowing your people to keep spending the greater proportion of their time doing real value-added work.

Here’s what to ask of your analytics team

For this section, I’m going to speak directly to them, but it’s important that you, the business leader, hear it.  

  1. What is the real question being asked?

You are deeper in the data than almost anyone else.  As such, what someone asks for versus what they really wanted versus what’s possible can all be different.  These are some of the better questions I have found to ask before starting the real work:

  • Can you (person making the data request) tell me what you’re ultimately hoping to find out or use this information for? Too many times people ask for something specific, thinking they know what it is.  But when you actually get context from them, you can suggest other ways of exploring the issue.  Or you may find something else that no one was initially expecting.  (This question, by the way, when asked from a worn-out team member, can come across as confrontational when it fact it should come from a place of service.)
  • Can I repeat back to you what I think I heard to make sure I’m hearing you correctly? This should be standard for anyone receiving a request. Of any sort.  Especially when it can take up a good amount of someone’s time.
  1. Make it as easy as possible for someone to “Get it”

I thought this year’s season finale of “Silicon Valley” exemplified this point really well.  But I was so frustrated by what I thought was the real point.  In the show, a tool (it doesn’t matter what it did for our purposes here) was unbelievably powerful, but no one understood how to use it.  It had been optimized for engineers, not consumers.  (In the show, they seemed to completely miss the UI lesson.)

The same is true for analytics.  Hopefully most of the people you’re working with are bright, but they don’t want to struggle to understand what you’ve done. Your effectiveness in your role is in large part dependent on your ability to translate complex analyses into simple, easy-to-understand, actionable insights that other people can understand quickly.  If you can’t easily explain a chart to yourself, get it out of the deck.

Let me repeat that in a different way.  Your job is not to show off every step you took, all the nuances and edge-case exceptions, nor all the technical details of the data.  Your job is to take all those hours of work, ugly spreadsheets and annoying data manipulations and put the end result and suggested next steps onto 1-2 summary pages.

This is what people who are great at their task, in any field, do.  They make the hard look easy.  Ever tried swimming the butterfly stroke or doing a back handspring?  Ridiculously difficult.  And yet, all we see is the end result, never knowing the struggles and challenges others faced.  Same with entrepreneurs, actors or master artists.  And it’s the same with you.

  1. Telling a story with the data

It’s not just marketing who is in the story-telling business.  Whether you’re sending out a regular report or sharing learnings from some ad-hoc analysis, what is the value in what you are sharing? Add some color or highlight something that has changed.  Said in a different way – add some real value.  Particularly for ad-hoc analyses, what is the real message that the data has helped to reveal?  Where did you start and where did you end up? Why? What did you come across along the way? Where did it lead you?

  1. Look at your subject lines

Examine your own behavior, whether in emails you open or on headlines you click on in social media. You’re much more likely to click when the subject line is hard-hitting, piques your curiosity, or just seems relevant.  If you’ve spent some time on your work or have found something you feel is really cool and actionable, it’s your responsibility to make sure you communicate that effectively.  The first step in doing so, if you’re sharing your results via email, is that subject line.

As a side note, it is unacceptable to say that you didn’t follow up because you didn’t hear back.  Walk down the hall or call the person to schedule a time to review what you sent over.  They may have missed it because your subject line was, well, you know…

  1. Know your audience

Everyone processes information differently.  As such, how you communicate to “pure marketers” is likely to be, nay, has to be different from how you communicate to the CFO.  Take a moment to think through the kinds of questions marketers asks versus the CFO.  Those questions reflect a different lens through which they view the same company.  And at the risk of taking the analogy too far, it’s your job to make sure your analysis is in focus for them, not the other way around.

How you present your analysis, as with most things in life, can make a huge difference.  Remember that when you’ve been deep in the data for so long, you know all the nuances, the side analyses you ran, or the way you joined several datasets.  And because of that, it’s easy lose sight of the fact that the people you are presenting to have zero of that context.

So look at what you’re presenting as if you’d never seen it before.  Would someone who has just come from another meeting to look at this understand what’s happening pretty quickly.  Size, design, layout, tables vs. graphs, colors.  Don’t go crazy but these all affect how your analysis is processed.  Learn what your audience prefers and deliver it so that it makes sense to them and in a way they prefer.

By the way, I ESSENTIALLY JUST SAID THE SAME THING 4 DIFFERENT WAYS!! That’s how important presenting information is!

  1. Educate the rest of the organization

Take it upon yourself to educate others on the business of the business. Walk them through the LTV model, show them the levers, show them what they can impact, show them why your analysis priorities look like X and not Z.  You have (or you better have) found trends, anomalies, mistakes, or opportunities that can benefit the business.  You need to create the venue to share those learnings.

  1. Review your work

On a different note, the best piece of advice I received when I was 22 years old was, “After you’ve spent hours working on something, take 5 minutes to look at it with a fresh set of eyes. And ask yourself, ‘Does this actually make sense? Do these numbers and results seem reasonable?’”  This prevents you from showing gross profit larger than revenues or showing more customers on a subscription on day 60 than started on day 0.

  1. Set up internal checks in your spreadsheets

Don’t get too cocky about how good you are, especially the more complex your analysis or model is.  Use some of that skill to guard yourself against mistakes.  For example, you can have a cell that only displays text when your numbers don’t foot.

My favorite story about this was when a partner at an investment bank was going thru a friend’s deck. He got to a page and told my friend, “These numbers are F’ed up.” To which my friend said, “No way, they are right.” Which prompted the partner to turn the page around to show an alert that the analyst had set up but had clearly not looked at.  And in big bold red letters were the words, “These numbers are F’ed up!”  Set up checks.  But again, take a moment to look at what you’re presenting.

  1. Stop thinking everyone else has it better

At some point, you’re going to have to get over the fact that your dataset is not perfect.  Some companies have better data.  Some have worse data.  But no one has perfect data. Nothing remotely close to that.  Whatever you think some other company has going for them, I can almost guarantee that there is a good amount they aren’t happy with.

This doesn’t at all mean that you stop pushing for data integrity and better systems.  There are certainly levels for each, below which doing analyses is painfully difficult.  But having seen companies large and small, what I can say is that everyone thinks everyone else has it so much better.  When in fact, everyone is a work in progress.

  1. Get over your insecurities

A wise man once told me, “You will succeed to the degree you deal with discomfort.”

I get it.  You aren’t as aggressive as some of the other folks.  People don’t realize how bad the data actually is.  Being a self-promoter doesn’t come naturally to you.  Those senior folks are pretty intimidating.

I certainly don’t mean to cast analysts as weak or feeble.  Far from it.  But I can guarantee that those statements resonated with a whole bunch of analytics folks, just as the first set of scenarios did with the business leaders.

At some point, you have to make a decision to step up.  If you are serious about wanting to help the organization, that’s what it’s going to take.  And certainly, if you are serious about advancing your career, while it’d be nice if everyone were nurtured and developed by their bosses, ultimately you have to take ownership and responsibility for how your career progresses.

A couple notes to the VP of Analytics (assuming you have one)

Most VP’s of Analytics were formerly analysts themselves, where individual contributions were rewarded.  Managing a team is different, but making that transition can be a challenge (again, this holds for many areas well beyond analytics).

And so, speaking to them…

One of the hardest areas to get comfortable with is the idea of training your folks to do something as opposed to doing it yourself.  In the short run, it’s faster to just do it yourself, but part of gaining leverage is the investment you have to make in your team.  That means things will take a bit longer. Will be done a different way (that doesn’t always mean wrong as you’ve hopefully figured out).  And will result in satisfaction and loyalty from your team.

As I see it, you have a few key responsibilities:

  1. Make your team look good. As much as possible, give them credit.  Don’t worry, you will get the secondary credit, since it’s your team.  But while you might have been used to hearing the direct feedback about the good work you did, make sure your team is getting that credit now.
  2. The opposite also holds – if there’s a mistake, shield them as much as possible. This isn’t to say you don’t hold them accountable.  But if there’s a mistake, it’s in part your job to identify it before analyses is presented.  And it’s not lost on me that this can difficult when you are getting your team up to speed.  But if you throw them under the bus in public, you will lose in the long run.  Trust me on this.
  3. Part of your job is to buffer your team from unnecessary requests. This includes requests from the CEO, whose requests can easily get bumped to the top of the list, with almost no regard for whatever else is in queue.  CEO’s rarely filter requests and are known to just send out requests without having a true appreciation of the time and effort involved.

Getting to ROI – A final thought for you, the Business Leader

I know it’s easy to get frustrated with your teams.  As much as that list above is a solid set of areas that you and your analytics team can address, who in your org is ultimately responsible for helping them to get better?

Certainly, it’s important to know where the gaps lie.  If it’s a presentation issue, then look to see who presents information well in your company.  Don’t just look at the “numbers” or finance folks.  In any department, who presents well? Yes, presenting quantitative info is a bit different than presenting creative concepts, for example, but there is still a lot that transcends functional areas.  If it’s one of the other issues, again, think about who in your company does that skill well.

It was intentional that the vast majority of the points geared towards the business side were around philosophical and mindset issues while those for the analytics team were more about communication and day-to-day tactics.  Both sides play a part, as they do in any relationship.  But I’ve also found it’s more effective to approach improving these specific relationships in this way.

That being said, making some adjustments to how you operate is possible and arguably very high ROI.

But I’ll ask the question again – who is actually accountable to develop your analytics team? Meaning, who is helping them how to do their job better?  Who is teaching them how to determine which analyses can lead to something actionable versus ending up in that “interesting but not really relevant” bucket?  And for goodness sake, who is teaching them how to present their analyses in more effective ways?

So that you actually look forward to meeting with them. Because they get you what you want, in a way that you can understand it. And because it leads to something you can take action on.

As opposed to ending those meetings feeling more drained and frustrated than you were an hour earlier.

Just imagine for a moment that at the end of a metrics meeting, you think the following, “Wow, I actually understood what was presented.  It was even more than I had asked for, and best of all, someone else had done the thinking and presented me with a few ideas on how to take action on what we just covered.”

That is not a pipe dream.  That is what a high-functioning analytics organization delivers.  And even if that seems too pie-in-the-sky for you, wouldn’t you rather be closer to that supposed pipe dream than the reality you’re facing today? I’m guessing if you got to this point, the answer is yes.

There is a way to make what you’re doing better.  Maybe there’s an implied judgment in there, but really it’s about acknowledging where you are and then deciding to make it better.

And that’s the sort of decision that you don’t need a metric to help inform.

It’s your move now.

I’d love to hear what are some of the biggest challenges others have faced from your analytics teams?  And if you’re on that team, what is your biggest ask of folks who essentially are your customers?

We Sat at the Restaurant an Extra Hour and No One Ever Came By

The wait staff may have been indifferent or clueless. But I’ve got to believe that the owner would’ve lost it had he found out.

And I’m guessing this sort of things happens all the time in most every other business.

To set the stage, a good friend and I met up at Clutch, a restaurant in nearby Venice (California, not Italy…). At 2pm, it would be a late lunch for me, but there were a decent number of folks seated. My friend wasn’t eating, so I ordered and started eating before she’d even arrived. Halfway through the meal, she arrived. The waitress asked if she wanted anything (she didn’t), and asked if I wanted another beer — I said not now, but I might in a bit. (And yes, I was drinking a beer at a late lunch on Friday. Back off…)

We shared a dessert and closed out the tab.

We then sat at the table for another hour talking. Having worked in a restaurant before, I’m mindful of taking up seats, but there was no crowd and so we weren’t pulling any business from them by sitting around.

But here’s the amazing thing and the missed opportunity.

Not once after we’d closed out the tab did someone come by to ask if we wanted anything. No water. No following up since I’d said I might want another drink earlier. And since we were there an hour, that might even be due cause to ask if we had gotten hungry again. But nothing. Nada.

Sure, it’s nice not to “be bothered.” But if you ask in a respectful way, there’s absolutely a way for the wait staff to ask if we wanted something. I’d argue that someone should do so every 20 minutes. At least get a verbal “I’ll let you know if we need anything else.”

And here’s the bigger thing. How many other times across numerous areas in the restaurant, or in your company, is there missed opportunity. We’re talking about live people who have purchased something just sitting around. The ask doesn’t get easier.

It doesn’t even matter what our response would’ve been in this particular case. Getting a yes is a numbers game to a certain extent. But you’ve got to ask the question.

And I liken asking the question to advertising. People think no one wants to get asked the question. Just like many people think no one wants to see advertising. When in fact that’s absolutely not the case. People love seeing ads. The ones that are relevant to them. Or entertaining. Or inspirational. People just hate seeing bad ads. One that have nothing to do with them. And getting pestered incessantly by them. Just like when people are being pestered by a salesperson. Or wait staff.

But if someone is in your place of business (whether physical or online), and especially when they’ve bought, it’s reasonable to say they are interested and half-way expecting an ask. Doesn’t have to be a rude ask. But an ask nonetheless.

And if you’re a business owner, don’t be so sure your people are doing so. That’s why the secret shopper is an important test to run. Or going through your own site as if you were a new customer, full through to buying and then even returning or cancelling.

As you scale, you have to put some trust in the people on the team, whether 1 level down or 5. That’s one area leverage comes from. But in my opinion, you also need to balance that with a healthy sense of paranoia to check on your business, especially when it comes to sales and customer experience.

You just might find out that that your people, or your site, isn’t going in for the ask. And that kind of missed opportunity is one of the most frustrating. But it can turn an expensive miss into a win.