
A couple years ago, I dug into the Blue Apron S-1 here. People seemed to liked the way I broke down what wasn’t always explicit in their filing. I figured it’s time to do another breakdown.
The one similarity they both have is that their S-1’s seemed to be written to disclose only the info they wanted to share. That’s where the similarities end, as we’ll get into.
I believe in cutting to the chase and then I’ll get into the nitty gritty. So here’s my summary take on Peloton:
–Peloton essentially acquires its customers for free – meaning, their gross margin on the sale of their bikes covers their customer acquisition costs. Not just of their media costs. But of their fully-loaded marketing costs, inclusive of people and showroom expenses.
–They have 500K+ ridiculously fanatical customers who seem to be churning out at less than 1% per month. We’ll dig in to this figure, but even if the figure is 5% per month, which I don’t believe it is, it’s one of the highest retention rates I’ve seen in a subscription business (comparable to DirecTV in its heyday and Netflix). And certainly remarkable for a fitness biz where the average lifetime is 3-6 months.
–Yes, they have $200MM (and growing) of Operating Expenses they have to cover. They’ll need to increase their subscriber base by 50%-100% to cover those expenses, which will likely go up as they continue to scale. Or they increase revenue/margin dollars per customer. THERE ARE AT LEAST 2 UNTAPPED OPPORTUNITIES THAT ARE NO-BRAINERS FOR THEM TO DO SO. MORE BELOW…
–If/when the economy turns south, my guess is that they’ll dial back their acquisition machine, cut staff, and dial back new major higher-investment initiatives. The question is whether those 500K subscribers continue to pay their $40/month. Based on my experience at Beachbody during the Recession, I have some thoughts here.
-Bottom line, Peloton has built a following that is ripe for much further monetization, and the Company likely can navigate a downturn in the economy and/or new customer growth.
Now Digging In…Let me get a couple things out of the way
What I did NOT like about the S-1.
I’m a big fan of Peloton as a consumer and more broadly about the business based on what I found and was able to decipher thru the S-1 (not to mention what I’ve seen over the past few years). But rather than start with a love-fest, I’d rather address some of the negatives first.
First, the LTV figure they provided – based on subscription revenues only.
This is just a silly figure they’ve put out there. It doesn’t have context and frankly is based on an expected time period that isn’t realistic. In trying to show a massive figure, I think they hurt their credibility. It just doesn’t seem like they needed to do so. But here’s what they did:
It’s based on the monthly fee ($39), gross subs added, expected lifetime (more in a second), and an adjusted subscription margin. Btw, the number of “Adjusted” figures in the S-1 is a bit too much. You can see my calc’s below – the numbers tie out, but it kinda gives you a headache trying to reconcile what they’re referring to.
As for the lifetime in the calc below, it’s based on the monthly churn. 1 divided by the churn to be precise. In a business with 8% monthly churn the lifetime would 1/.08=12+ months. Based on the churn figures Peloton has provided (which overall do NOT seem to be radically inflated) – less than 1% – the average lifetime is ~160 months, which translates to 13+ years.
I just don’t see the point in making this assumption. I’m a massive Peloton fan myself but there’s no way I can conceive of being a subscriber for 13 years. Now, it’s highly possible that they generate the same amount of money from me and other subscribers over a shorter period of time, but using 160+ months as the expected lifetime is, well, not believable. Now, they don’t actually say 160 months – they just describe the calc. But that’s what it’s based on.
And as you can see in the below, customers who were acquired in 2019 are expected to generate over $1 billion in revenues over their lifetime. Over 13 years.
Um, ok.
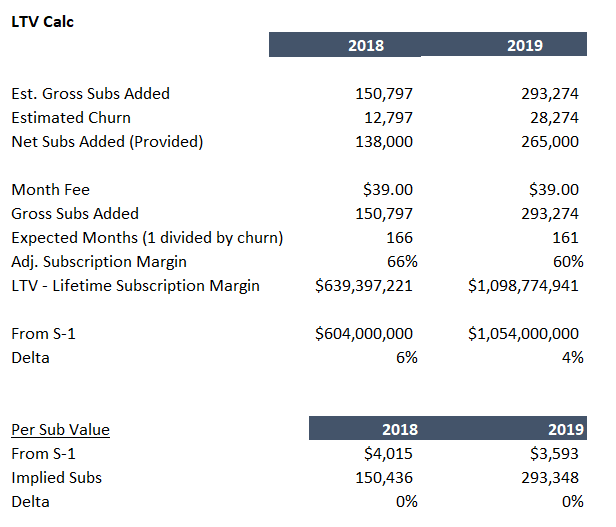
A couple other points about the above. I’ve backed into the estimated gross subs added and churn based on figures they provided. You can see the delta from my calc of LTV to what they provided – it’s ~5%. I’m good with that margin of error.
Similarly, on a per subscriber basis, my calc of the # of subs is essentially identical.
That $3,593 says that over the course of 13 years, these customers will generate $3,593 of margin dollars.
One word on the margin % calculation. It’s one of their “Adjusted” figures, backing out Depreciation & Amortization, as well as stock compensation expense. Both adjustments are not unusual. But they also back out the costs they’ve incurred for “Content costs for past use” – as below. Basically, they used content they didn’t have the rights to. Or as they say, it was “alleged past use.” I’m not sure why it’s alleged. Since everything is recorded, it should be part of the record to prove one way or another. These fees below are $45MM over the past 3 years. Really, they sound like fines and shouldn’t give anyone the warm-and-fuzzies.

But these costs have also been backed out of subscription costs and increase subscription margin by 9 percentage points (not 9%, but percentage points) in 2019. Meaning, subscription margin increased from 51% to 60% as a result of backing these out. Whether these will continue is anyone’s guess.
What else that I didn’t love:
–No real detail on cohorts – counts, LTV, churn. All are at the aggregated level. I take a stab at reconciling their figures below. It would appear the numbers in the S-1 are at least directionally representative. If that’s the case, then why not share more detail? If your cohorts really are that strong, then share the data – most everyone else doesn’t. They’d stand out even more if they would do so.
–This awful definition of Churn:

Particularly in a fast-growing business (subs are literally 5x from 2017 and 2x the 2018 figures), taking the current period’s cancellations relative to the beginning of period subs figures – well, it doesn’t tell you much. Who is cancelling? Are they recent subs or older ones? This is why cohort figures are so important.
The quarterly figures provide at least a small bit more visibility into what’s happening, but not at the level of detail that most of us would prefer. And as I alluded to above, the typical thinking is – if you aren’t sharing the info, what are you trying to hide? And from the other side, sharing the info is such a strong sign of confidence.
Later in this post, I do my best to make sense of their numbers. There seems to be a recent trend of increasing cancels – both absolute and percentage-wise, but it’s not a crazy figure. At least not yet. And they still have some pretty strong fundamentals we’ll get into.
-Content Costs for Past Use – I mentioned this above, but it deserves an additional call-out. Essentially, Peloton has paid fees (fines) for using content (presumably music) without having the rights to do so. To the tune of $45MM over the past 3 years. Which doesn’t include at least some of the $19MM in litigation expenses.

I don’t like it for a few reasons: a) anyone who has any IP knows what a pain it is to enforce it – IP rights are only as good as the oftentimes-deep pockets you need to pursue those breaching those right; b) there’s a much bigger lawsuit by more content rights owners, seeking $150 million in damages. Who knows what amounts will be paid and/or whether that’ll show up as cash fines or stock ownership for those parties. But given Peloton’s history, it’s reasonable to expect some amounts will be paid out.
–Almost 2,000 employees. Wowza! That’s a lot of people. Sure they have ~80 showrooms, and this is a billion dollar biz, but that’s a lot of people.
–This wasn’t in the S-1, but it’s posts like this which can be indications of operational issues. There were 235 comments, many describing a similar experience. Not good. There will always be exceptions. No one is perfect. And as much as my personal installation experience (of the bike, not the treadmill) was outstanding, this doesn’t sound like the exception. This type of stuff can be the result of growth outpacing operational support. It just better get addressed very quickly.


Okay, now to the positives.
Customer Acquisition:
I mentioned at the top that they essentially acquire customers for free. Basically, the margin they make on their bikes and treadmill covers their sales and marketing costs. What’s particularly amazing is that these costs include people and rent. In most performance marketing businesses, we look at media costs and then exclude the costs of people. But Peloton is essentially breakeven for each bike/treadmill they sell.
Below are my estimates of revenue, calc’ed gross profit and CPA (based on my new subs figures above) – all on a per-customer basis. You can see the comparison of my figures to those provided in the S-1. It’s a pretty good match.
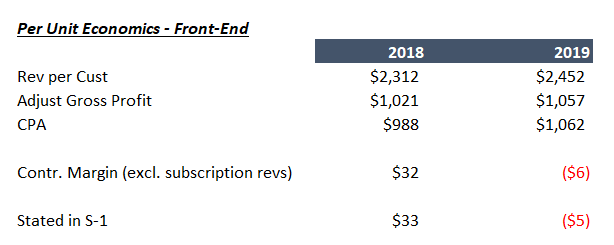
Now, I wouldn’t say this is unheard of in fitness businesses. To be breakeven on day 0. I’ve done it in businesses I’ve been involved with and seen it with my clients. But it’s still pretty awesome when it does happen.
The implication is that everything they generate afterwards is margin. Or you could say they don’t make any money until the next sale. But it’s still better than the majority of venture-funded businesses that go in the hole for 6-18 months before being breakeven on a per-customer basis. Peloton is breakeven on a per customer basis pretty much on Day 0.
Subscription Revenues and the Rest of the Economic Model
Whether you believe the fees for use of prior content is in the past or they’ll continue to incur these fees, their Adjusted 2019 subscription margin was somewhere between $92MM and $108MM. That’s pretty good. Until you look at the nearly $200M of OpEx they incurred – a combination of R&D and G&A.
In this case below, I don’t think it’s unreasonable to back out stock-based comp expense nor D&A, especially when considering the business’ going-forward model.

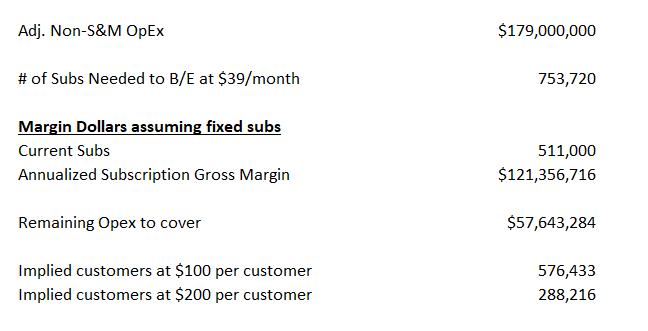
$179 million in non-sales and marketing expense is pretty hefty, at 20% of revenues. And of course, that’s for the full year. It’s very likely their run rate figures are even higher as they continue to invest in their business. As for the 20% figure, for Peloton and with their model, it doesn’t seem so crazy. But what are the implications and what is it going to take to get to breakeven?
Looking at the figures below, assuming $179 million in OpEx, that implies they’ll need 753K subscribers to pay $39 per month for the year. But they’ll likely incur greater OpEx to get there.
If we look at their current base of 511k, with no net change in subs, and paying $39 per month for the year, they’ll generate $121 million in gross margin. That leaves $58 million left to cover.
Somewhere in this model, there has to be greater efficiency and leverage.
Can Peloton get to 753K subscribers and beyond?
What is going to take to get there?
What happens if they don’t grow?
I’ve got a few thoughts.
The last two lines in the above table are calc’s showing that if Peloton can generate another $100 in margin dollars per customer, how many would they need to cover that $58 million. It’s simple math. They’d need 576K subs. A bit more than they have today.
And if they could generate another $200 of margin dollars per customers? That’ 288K customers.
Now you’re probably wondering how feasible it is to get the annual revenue from subscribers to increase from $468 ($39*12) to $568?
I do NOT believe it comes from converting Bike buyers into Treadmill buyers. But rather…
- Apparel – the “Other” revenue line reflected ~$15 million in revenues in 2019. That’s a massive opportunity waiting to be capitalized on. Frankly, during my time at Beachbody, we didn’t sell much apparel either. But when customers are fanatical about a health and fitness product – as they were with P90X and Insanity – and certainly as they are with Peloton, they love being walking billboards for the brand. “Oh, this Peloton sweatshirt? Oh, I forgot I’m wearing it. But yea, I have a Peloton. I looooove it. Did you have one? Let me tell you all about it…”
It’s a no-brainer in my estimation. Now, if they put together a referral program a la Morning Brew, and turn those customers into referrers and compensate them with apparel, that might not generate apparel revenues, but it’s a customer acquisition channel that is a ton cheaper than the current $1000 they pay to acquire a customer.
You don’t think a customer wouldn’t be absolutely thrilled to get a Peloton sweatshirt or cycling shirts or tank for every customer they referred?
Okay, so I combined 2 point in there – apparel and customer referrals. Yes, they get a ton of word-of-mouth benefit already that is driving referrals. I’d think that compensating customers with a piece of apparel would move the needle further.
2. Supplements – this is the MONSTER opportunity that I think Peloton has waiting in the wings. I have zero info on whether they’re spending any time here. But think about it. A rabid customer based that is obsessed with the brand, the trainers, and with being healthier.
Pills, powders, shakes, bars. Generally high margin, another source of recurring revenues. And an entirely reasonable way to generate another $100+ of margin dollars per customer.
Both of these draw on one of the big wins that Peloton has achieved. I’ll get to that just below, but I first wanted to share why I think Peloton can win.
Sorry, the marketer in me can’t help but mention untapped opportunity #3:
3. Email – they could do it better. Frankly, they haven’t needed to. Communicating with their customers via email extremely well, especially after the purchase, hasn’t been a necessity. But if/when they really emphasize product sales like the above, they’ll need to get it dialed in. It’ll happen. Just a matter of time.
Ok, why Peloton can win…
The Peloton Family is Real
I posted this a couple days ago on Twitter. Look at the post below. It had 5,000+ likes and over 250 comments. The fact that a customer shared difficulties about their personal life in the Peloton Facebook group and received such love, both from the community and from Peloton itself, speaks volumes about the brand.
Major props to the Peloton team for the hand-written card and apparel they sent.

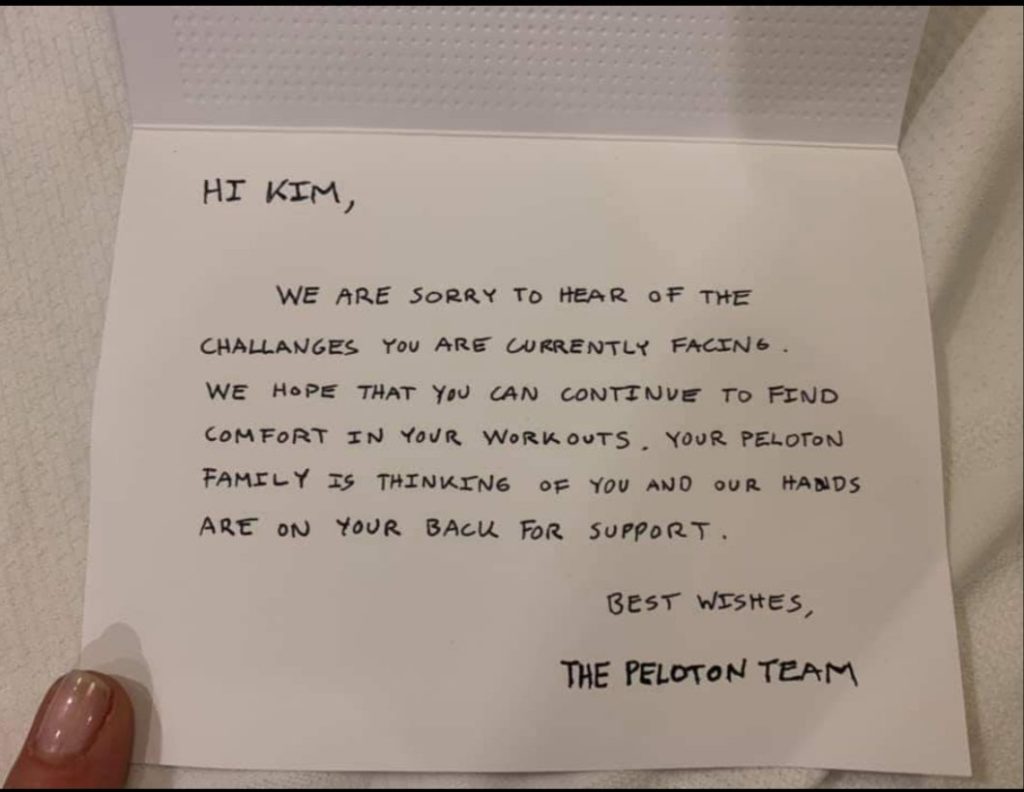

This type of thing doesn’t happen overnight. And when you think about competitive advantage, this is huge.
They have nailed the Customer Experience
Here’s a list of what they nail:
-The bike
-The instructors
-The tablet
-The quality of the streams
-The workouts themselves
-The music
-The leaderboard
-Sync’ing with Spotify
-The Facebook group
-The shout-outs for anniversary rides
-Hours upon hours of new content every day
The list goes on and on. So many of the core areas that make a difference. Peloton isn’t top-notch at everything. But they do more than almost everybody at the sheer count of things they nail. It’s for this reason that they are able to use the graphic at the very top of this page describing themselves not just as one thing. But as many things.
I’ll give them their due. They create a customer experience unlike almost anyone else.
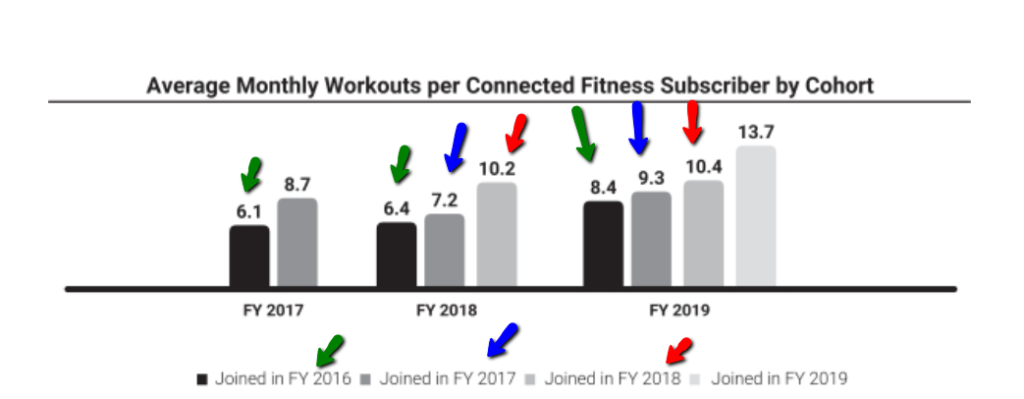
Increasing workouts per cohort
This graphic below is pretty unreal.
For starters, it may not sound like much to get customers to workout 10x per month. Every 3 days doesn’t seem that much. 2+ times per week. But there are very few fitness companies that get their customers to do so. At home!
And then to see the count of workouts increasing for a given cohort over time – that means customers are working out more per month each year. Again, this is remarkable.
How are they doing it? Well, they now suggest a workout when you finish a ride – upper body, core, stretching. An extra 5-10 minutes. Does this mean that the nature of the current workout count is different than those in prior years? Yes. But it also highlights something that Peloton has been doing for years.
They announce anniversary rides when their folks hit a special number. 50, 100, 500, 1,000. Could customers cheat? Yes. Can they do shorter rides versus longer rides? Yes. But Peloton and their customers don’t care. And don’t care to keep track. No one asks whether someone did 100 20-minute rides or 45 minute rides. It’s all about engagement and support.
The Churn Figures Seem Real
I took a stab at trying to back into the churn figures.
Walking thru the chart below, I note which line items were provided in the S-1. I then calc’ed the incremental subs each quarter (line A) and calc’ed the monthly rev / subscriber just to make sure the numbers made sense.
I think looked at their Connected Fitness Product Revenues (basically sales of bikes and treadmills), and then based on some average revenue per customer figures I’ve estimated, I back into the Implied New Customers (line B).
For the most part, line A and B are pretty close. Q3/Q4 2019 (the March and June quarters) show the highest variance. To the extent more recent sales have skewed towards the Treadmill and the AOV is higher, that would explain some of the difference. It’s also possible that the Digital Subscribers (those with a subscription but without a bike/treadmill) is increasing. Or, as I mention below, churn may be increasing.
Using Line B, I show CAC, which mirrors what I’d done above – basically a $1K cost to acquire a customer.
In Line C, I look at the difference between A and B. This is a proxy for churn – the new customers are higher than the incremental subs. Presumably most buyers become subscribers, so the difference is likely churn. The one potentially worrisome metric is if the Q3/Q4 figures on line C are in fact churn. In count, those are the highest absolute figures on the line, though still directionally in line as a % of the base. It’s just a question of which cohort those people are connected to.
Finally, I calculate churn based on the methodology they describe in the S-1. I don’t have monthly subs figures so I just took the average of the beginning and ending of the quarter, multiplied by the churn percent at the top. You can see the difference b/w this churn (line D) vs. the one above (line C). Again, not perfect, but pretty close.
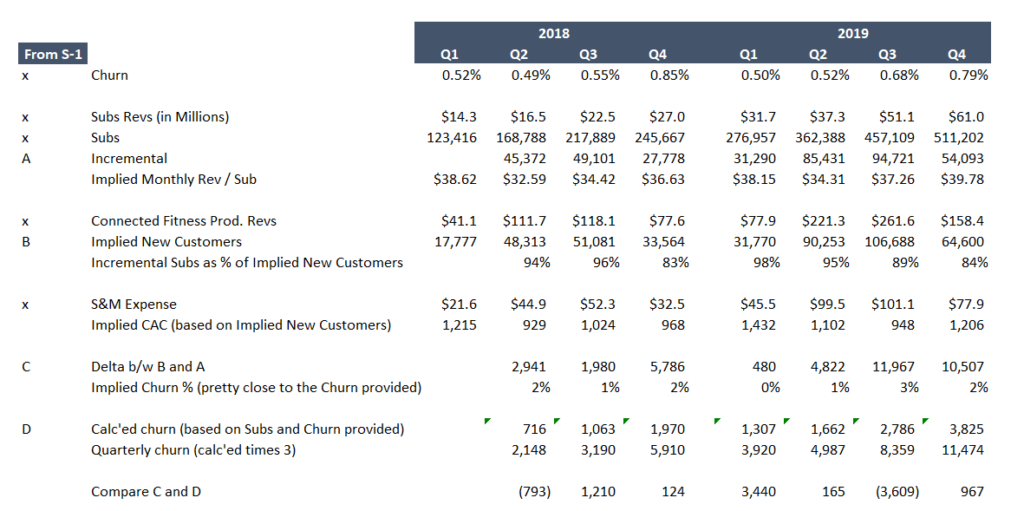
Yes, it’s possible churn is increasing, albeit with a noticeably larger base. But for the most part, my calc’s seem in line with the figures the company shared.
Btw, I’ve seen some mention that the Company figures don’t take into account those on an installment plan. There have been comments suggesting that these customers are not able to cancel their subscription just yet. And when they finish their installment billing (up to 39 months for the bike, 24 months for the treadmill), we’ll see higher cancels. From everything I’ve read, the subscription is NOT tied to the installment plan, so a customer isn’t locked in to the subscription should they want to cancel that part. Nor does Subscription Revs include the installment payments. As such, it doesn’t appear that there is mixing and matching, nor do these installment payment customers seem to be skewing the churn figures one way or another necessarily.
(Update: In July 2018, Peloton ended an offer whereby the subscription revenue was either prepaid and/or bundled in to the purchase of the bike. Those plans lasted from 12-39 months. The current offer allows for financing of the bike itself and the subscription is offered separately. There is no info as to how many/what percentage of new subscribers took the bundled installment plan. But it should be noted that some of these customers really haven’t had the ability to churn out, but their revenues are being recognized over time and the subscriber counts continue to include these customers.)
As for the final reason I think Peloton can win…
Have you ever spoken to a Peloton customer?
‘nuf said. They’re beyond passionate. And loyal.
The Bigger Win
What is it that Peloton has achieved?
They’ve acquired a massive number of customers. Of fans. Of devotees.
Of customers who will fly from wherever they live to do their anniversary ride in the NYC studio. Hopefully with their favorite trainer. And snapping a pic while they’re at it.
Of customers who love that they can click a button on their screen when a favorite song plays, and that song sync’s with their Spotify account.
Over the past few years, they established a foundation of half of a millioin loyal paying customers. That’s a very very asset to have created.
What happens when the market turns?
I’m guessing a few things:
– Sales of bikes and treadmills will drop. This seems like an obvious statement – again, based on the growth we experienced at Beachbody, it’s not entirely a given. But for now, let’s assume it to be true. If the company is watching its numbers closely, they dial back customer acquisition spend. Let’s assume it goes to zero. It won’t, but even if it did. New customer acquisition was operating at breakeven. It wasn’t adding margin dollars. But obviously adding new customers into the mix.
-How many customers stay on for $39/month? I was at Beachbody from 2007 thru 2015. We grew in a meaningful way thru the Recession, presumably because people gave up their gym memberships to buy a $60-$120 program. Let’s call it $100 they paid. Peloton customers are on the hook for $500/year. Are people going to stay on? And what happens to those that are on installment plans? To date, according to the S-1, bad debt has not been meaningful. Unless I missed it, they didn’t disclose any figures. But it will go up.
-It’s not clear just how much leverage they will get with their current OpEx and how much additional overhead is required to add 250K new subscribers.
-But if the economy goes south, they likely won’t get that additional 250K and will likely cut staff to consolidate around higher-margin opportunities.
$200 million of non-sales and marketing OpEx is huge. Their current employees don’t want to hear it, but realistically, cutting back on R&D and tightening up with those 2,000 employees, is something they’ll need to do.
But with coffers potentially of over $600 million post-IPO, tightening up as needed on acquisition and/or G&A, and expanding its offering into additional high-margin categories (ingestibles in particular), Peloton appears in position to grow. And certainly to withstand a market downturn.
Having 500,000+ active customers is a huge advantage. It’s a pretty good bet that if offered more, they’ll take it.
If all else fails, those 500,000 will come to the Company’s rescue.
That’s what families do.
And make no mistake, they’ve got a huge Peloton family.




Top-notch analysis. Thanks for the write-up!
i’m glad you liked it attila. thx for the kind note.