Analytics

How Blue Apron Revealed a Lot More about Customer Acquisition and Retention than It Likely Intended To

I’ll cut to the chase first.  I have no inside information, but my analysis has lead me to conclude that Blue Apron is acquiring customers at a rough CPA of $150, its current monthly churn appears to be ~10%, and the Company eventually nets ~$150+ of contribution margin over the lifetime of an average customer.

Those numbers aren’t written in their S-1, but the analysis used to come up with them is based entirely on the information provided in that S-1.  No one else, as far as I have found, has published them.  I frankly haven’t seen even educated guesses at specific numbers.  Other than saying that the current number is probably higher than the $94 figure they disclose in their filing – but that number is based on the average of 2014 through early 2017 results.

For background, I helped to build the analytics team at Beachbody, then ran media and customer acquisition there for the last 5 of my 8 years.  I’ve since spent the last 2 years helping my clients use information to dramatically improve their customer acquisition and retention efforts.  This isn’t an entirely new area for me.  And certainly, if someone or the Company proves me wrong, I’ll be the first to acknowledge it.

My goal here is to show how you can dig through information that may not be explicitly detailed and how I got to my conclusions.

More important than what the numbers they shared reveal is what the implications are for their own business as well as others in the meal delivery space, and the broader subscription business.  More on these points in a bit.

What Blue Apron Shared

The below graphic is the one that has been making the rounds.  It is pulled out of their S-1.

Chart #1

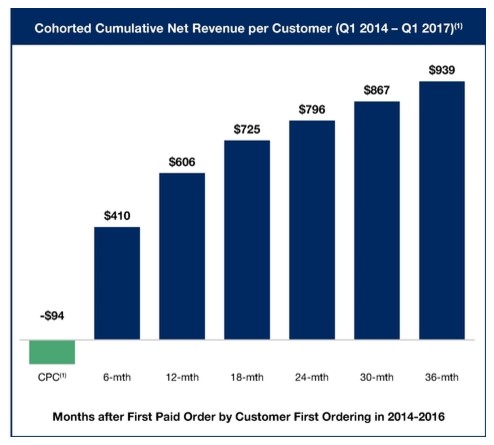
What the graphic shows is the average cost to acquire a customer during the 2014 to early 2017 period.  I’m not sure why it’s called CPC (“Cost per Customer”), but it’s more normally called CPA (“Cost per Acquisition”).  In addition, it shows the lifetime revenues for customer over various periods after their first paid order.  Since the date range considered is 2014 to early 2017, but we are only in mid-2017, the metrics shown for 30 months out and beyond are based on customers in the earlier part of the range.

Let’s also not gloss over the clearly very intentional label, “Months after First Paid Order.”  One frequently-used component of Blue Apron’s customer acquisition strategy has been to give away meals and/or the first box.  That language is specific, such that if a customer doesn’t pay for the first box, they are excluded from the lifetime revenues part of the table.

As for the Marketing Expense associated with these free boxes, there’s this language from page 67 of the S-1 – “Also included in marketing expenses are the costs of orders through our customer referral program, in which certain existing customers may invite others to receive a complimentary meal delivery…The cost of the customer referral program is based on our costs incurred for fulfilling a complimentary meal delivery, including product and fulfillment costs.”

Re: the definition of a customer:  “We determine our number of Customers by counting the total number of individual customers who have paid for at least one Order from Blue Apron across our meal, wine or market products.”
Which means the marketing expense captures the cost, but shouldn’t capture the count of customers if they didn’t convert into a paying customer.
Net net, I actually think the way I’ve done by analysis is okay given how they’ve calculated their metrics. But real churn, if you included free trial customers, would be dramatically higher.  Churn from paying customers is all I could calculdate.  But the fact that the Marketing Expense includes the product/fulfillment cost means they are correctly loading up their marketing numbers.

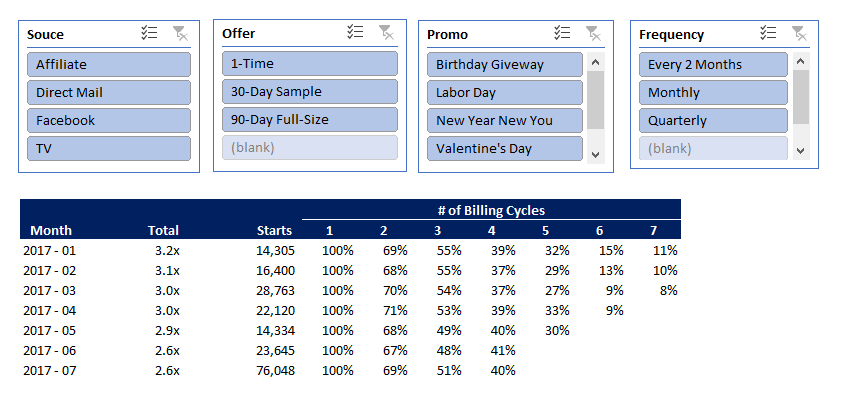
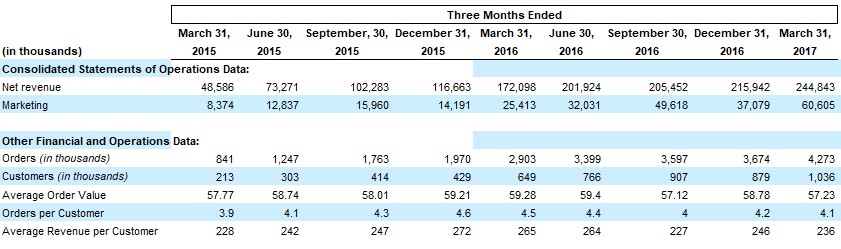
Next, the below is another table they presented. It’s an eye-sore for everyone, but has some valuable information in it.

Chart #2

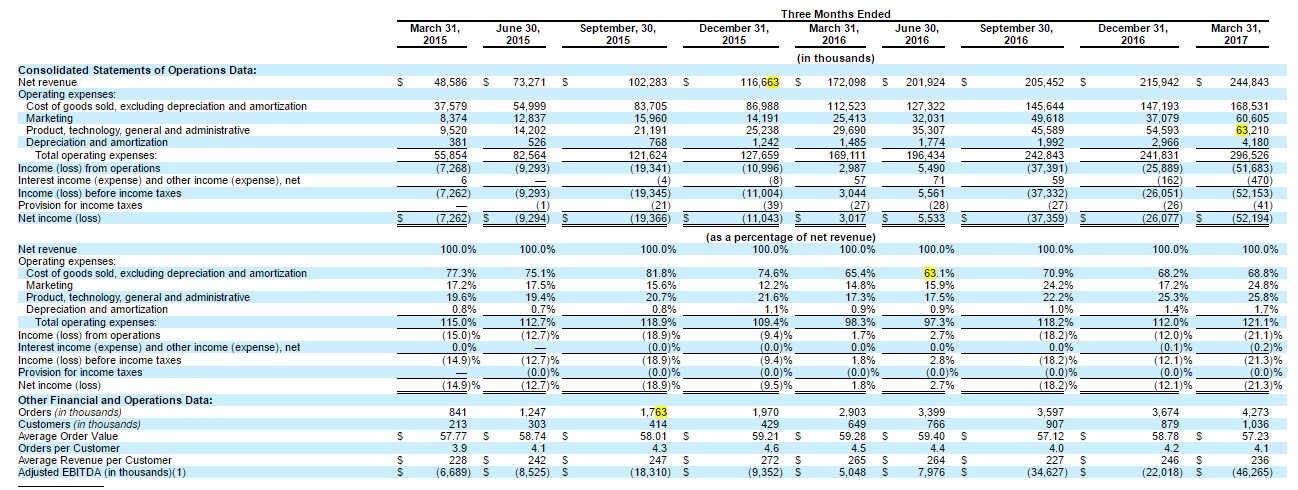
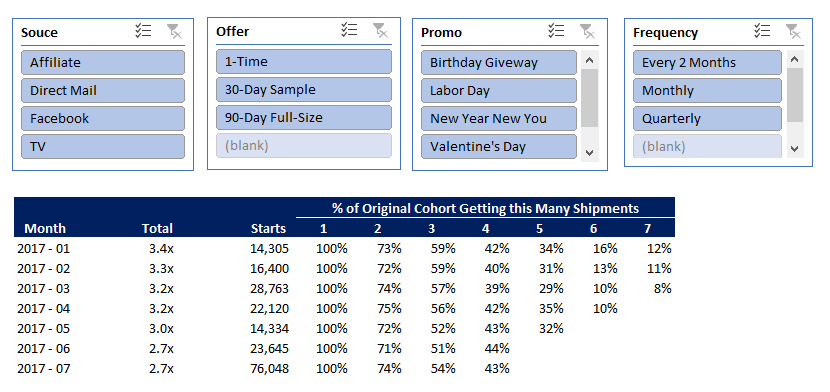
Here is a view of the more telling parts of this table.

Chart #3

Based on Charts 1 and 3, we have the information to calculate their acquisition cost and churn.

I’ll start with churn:

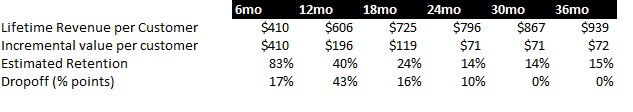
The first line is provided in Chart #1.  The second line is just the difference from one period to the next.  Now, the estimated retention is based on the following:

  • From Chart #3, it looks like the Average Revenue per Customer is roughly $247 per quarter. I’ve had to make some simplifying assumptions – this number is a simple average – not perfect but likely close enough.
  • $247 per quarter implies $494 per 6 month period. So if in the period from 6 months to 12 months in, customers generated an incremental $196 of revenue, then that implies that Blue Apron only has 40% of them left ($196/$494).  This is the calculation behind the 40% figure in the 12mo column.  The same math is used for the rest of that line.
  • Dropoff – this is the percentage point difference from the prior period – Note that I haven’t shown Day 0, which was the starting point, to calc the 17% for the 6mo column.
  • A couple things jump out, whether from the Estimated Retention Line or the Dropoff one.
    • Somewhere between month 6 and 12 is where the 50% figure is crossed, which helps to give a sense of the average stick rate of customers
    • Estimated retention seems to go up from month 30 to 36. My guess is 2 main factors are causing this:  a) we don’t have the exact same cohorts in the analysis, only what was available when the S-1 was put together, so it’s not pure apples-to-apples; and b) I’ve made simplifying assumptions based on Average Revenue per Customer, but I would guess that those customers who have stuck around 30 and 36 months have higher-than-average quarterly revenue.

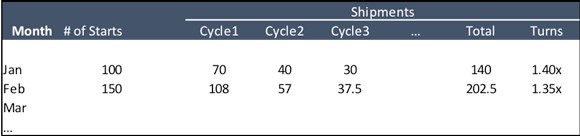
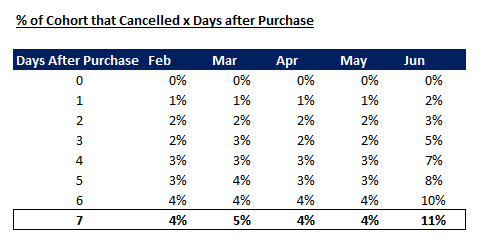
To get a bit closer to when the 50% threshold is crossed to give a sense of the average retention rate (at this volume, I think it’s fair to say that the mean and median are approximately the same), we can do some additional analysis.

Using a straight-line average of dropoff – use the figures at 6 and 12 months as the starting and ending points, respectively, we can generate this table:

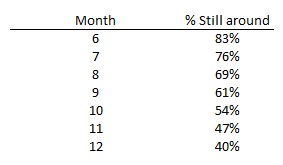
From there, it looks like somewhere around month 10.5 is when the 50% figure would be crossed.  If the average customer sticks around 10.5 months, that implies monthly churn of roughly 100/10.5 = 9.5%.

This figure is going to be supported as I get into the CPA calculation.  But one other way to back into that churn rate is to take the Company’s reported $939 of lifetime revenue, and divide it by the simple average revenue per customer, which I’ve calculated at $247 (per quarter).  That implies 3.8 quarters that a customer sticks around, or 11.4 months.

The simple average of these two calc’s would be 10.5 months.  I’m discounting a bit for scale to get to my 10% figured.

Couple additional points here – the average lifetime revenue from those cohorts in the 36mo column will go up.  They’ve simply reported the data they have now.  So arguably LTV will only get better, but at the same time, as the Company attracts a broader group of customers, that’ll be counter-balanced with lower-quality customers.  We can argue about what retention plans they have in place, do people get stickier to the service, etc., but for now, let’s assume this is all a wash.

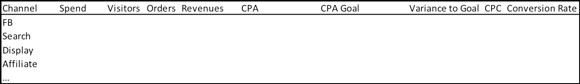
Now, to calculating the actual CPA Blue Apron is running at

The top part of this table is from Chart #3, the rest is the analysis based on it – my explanation of the table is below:

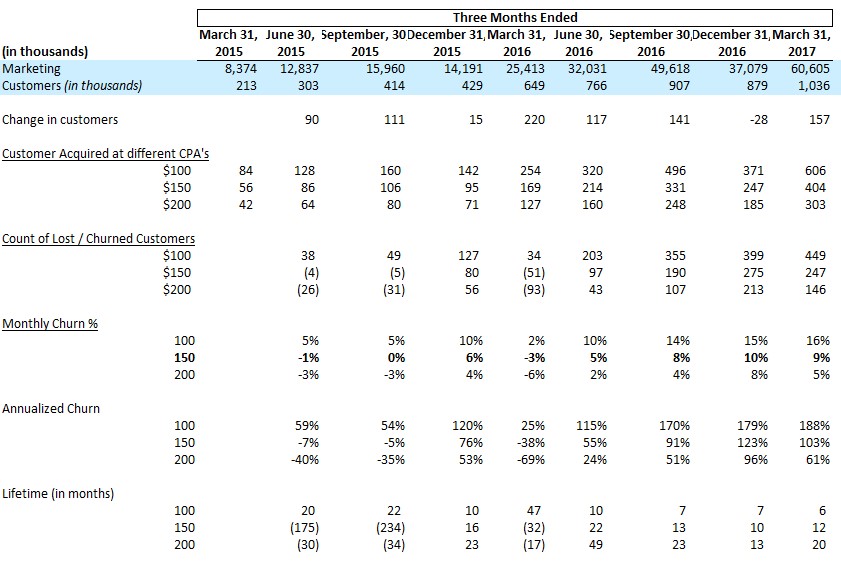
Change in customers is simple math – the net change in customers from the end of the prior period to the end of the current period.

The next section – Customers acquired at different CPA’s – shows the number of customers acquired based on the Marketing spend reported by the Company and based on varying CPA’s.  Since the average from 2014 through early 2017 is $94, I’ve made the assumption that the Company CPA has been increasing over time – not unreasonable at their scale.  I’ve just used simple $50 increments after trying out a few different ranges.

For example, for Q1-2017, based on $60MM of Marketing spend, and at a $150 CPA, that would imply 404K customers who joined during Q1.

Based on these figures and the net change in customers (to repeat, a calculated figure based on the table), the Churn section is then created.  At $150 CPA, that would imply the Company lost over 247K customers during Q1-2017.

Monthly churn is based on the average of the prior and current period figures, adjusted for the fact that those numbers are quarterly.  Again, sticking with the Q1-2017 and $150 CPA figures, that would imply churn of ~9%.  I’ve simply multiplied the monthly figures by 12 to show annualized numbers.  Anything over 100% describes a scenario where the Company is essentially turning over its entire customer base each year.  We know that in actuality that isn’t the case – there are clearly some customers who have stayed on for a very long time, but it’s a helpful way to make sense of those over 100% figures.

Finally, Lifetime in monthly is calculated based on the Churn percentages – the opposite of what I did in the original churn analysis.

Which assumption on CPA is correct?

If we assume a lower figure, that means that churn is higher.  And vice versa.

But if we layer on the first analysis here, and use the “starting point” of ~10% churn as a possible figure, that leads us to look at the $150 CPA line.  Note that during Q4 of 2015 and 2016, the Company lost a lot of customers, which isn’t unexpected given the holiday season.  Even with the Q1-2016 figure, as much as CPA doesn’t stay constant, the 10% churn figure and $150 CPA seem like defensible metrics for the business based on the information they provided.

Many folks have commented on the fact that Blue Apron didn’t explicitly reveal its churn.  But I wanted to share that it’s possible to back in to that figure.

As for the $150 CPA, it seems reasonably that the current CPA is ~50% higher than the average over the past few years.  At their volume, that isn’t unexpected, not to mention, they are going after more mainstream customers, as opposed to the early adopters.  That usually means spending more to reach those folks. Finally, competition has increased – everyone like pure competitors such as Hello Fresh and Plated, as well as additional options like Munchery, Uber Eats and even Door Dash – have no doubt made customer acquisition more costly for Blue Apron.

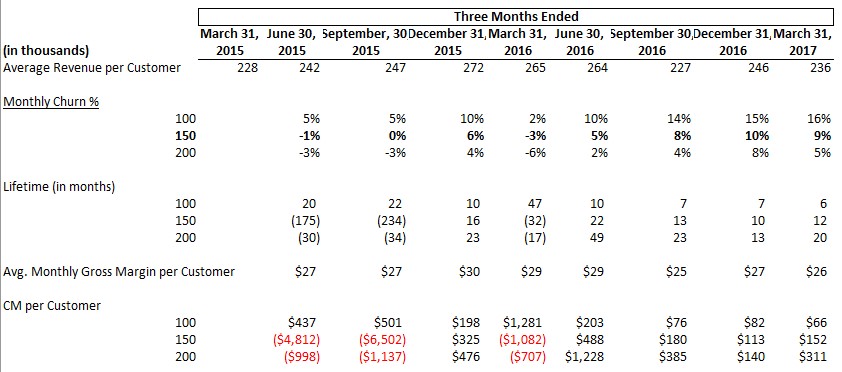
What this really means for the business, and how much does the Company make on each customer:

Using the average revenue per customer, alongside the disclosed cost of goods, the Company makes roughly a 33% Gross Margin on its revenues (Revenues less Cost of goods, which include product and fulfillment expenses).  Adjusting the quarterly revenue per customer to a monthly basis, the average monthly gross margin per customer is ~$26.  (Note, at a $150 CPA, that implies 6 months to breakeven on a customer, which is exclusive of all of the Company’s additional expenses such as G&A, capital expenditures, etc.)  If we then multiply that margin figure by the average lifetime, we get a lifetime gross margin, which when reduced by the acquisition cost, gives a lifetime contribution margin (“CM”) per customer.  At a $150 CPA, the Company is roughly making $152 per customer.

Implications for Other Businesses

For starters, Blue Apron has significant funding – almost $200 million according to Crunchbase. That has allowed the Company to operate at a significant loss for pretty much the entirety of its existence.  Many of the other larger food delivery companies are in a similar situation, though the vast majority of companies at large don’t.  In addition, operating in the red on a per customer basis for 6 months+ is more taxing than most companies can afford.

It’s also tough to run a business when 10% of your customer based is cancelling each month.  Those are figures reminiscent of my days at Napster in 2006, when the iPod was the hot thing and subscription music was widely criticized as a non-starter.  (This was also the period when Blockbuster came out with its competitive product to Netflix, and everyone “knew” that was the end of Netflix.  I think we’ve all seen how that worked out.)

10% monthly churn is really high.  As I mentioned earlier, that equates to turning over your customer base more than once a year.  Which puts dramatically more pressure on customer acquisition.  And while the company only has tapped 2-3 million total customers (I’m again making some simplifying assumptions), which is 1% of the US population, with rising competition, it makes its model more difficult.  Not that I’m betting against them necessarily.  More just looking at what their metrics seem to indicate.

Net net, this is a tough business.  The margins aren’t great, customer acquisition isn’t cheap, and retention is unlikely to jump from 10 month to 20 months in the near future.

Something would need to change for their model to dramatically improve.  With these dynamics, it’s not just a “we’ll make it up on volume” play.  But to the extent one or more of those components – core margin, acquisition cost, or retention – could change markedly, the model could be different.

The only one of these metrics that was likely reasonably understood early on was margin.  Until they (or anyone else) began testing, acquisition costs and stick rate were really unknowns.

Which go to the larger point for other businesses, whether in the same or other categories, and that is about how to get as quick an understanding about the business fundamentals and dynamics as possible.

To be clear, there are plenty of subscription businesses that are thriving, both in the food category and beyond.  This is absolutely not a criticism on the category – and frankly it’s not a criticism as much as it is a deep analysis on the Blue Apron business itself.

Every business has to manage through the relationship of Customer LTV and Customer Acquisition Costs.  And then must layer on constraints such as cash, risk it is willing to take, and business objectives – in determining the better path to proceed down and what strategic decision it wants to make as it evolves.

That is the challenge and the fun of forging ground in new categories.

I, for one, am certainly very interested to continue to watch Blue Apron along its own path.

What I Learned from Managing $500MM+ in Media and Acquiring over 10MM Customers

shutterstock_385192126

I’ve talked to a number of people recently who think that optimizing and scaling campaigns has this magical and mystical aura around it.  And that there’s some secret to doing so.

Well, I’ll let you in on the secret…

During my time as the SVP, Media & Customer Acquisition at Beachbody, we ran over $500MM in media and acquired more than 10 million customers. I now work with a variety of direct response marketers — helping them to optimize and scale their businesses, identifying not only gaps and opportunities, but also key points of leverage to exploit.

And whether at Beachbody or with my clients, I’ve found that just like everything else, there is no magic.

Instead there is a process to follow, primarily driven by a list of questions, to help identify gaps and opportunities in your business.  (Because oftentimes, those gaps and opportunities are where optimization and scale happens.)

Some questions have quantitative answers, others are qualitative.  Some questions identify gaps in…

  • information (oftentimes reports that should be run regularly)
  • a marketing issue (why you don’t offer installment billing, for example)
  • or a training issue (do your customer service reps know how to respond to certain customer issues)

Almost always, the first answer someone gives is not the entire story, and so pressing on additional questions can help to uncover the next layer of understanding.  Those questions are harder to script because they are dependent on the specific answer and/or individual responding.

Today I’m sharing the 6 category process I use to dig in to a business, regardless of whether it’s doing $10K a month or $100MM per month. The process is the same, it’s just at a different scale and level of complexity.

But it’s not for the faint of heart.

Most likely, some of what you’ll find from this process, you can take immediate action on, like training.  Other areas require testing.  (Where possible, PLEASE test before you change a control.)

But before you go out and implement anything, there’s one crucial step to take…

Prioritization.

Everyone is resource-constrained — for people, time, dollars, or traffic.  We would all love to test everything we think of, but of course we can’t.  And not all tests are created equal.  This is where doing a bit of math can help you to understand the possible impact of different tests.  You’ll likely have to make some assumptions but even with reasonable guesses, you’ll realize how little (or how much) a certain test could move the needle, when compared to others.

Here’s an example:

You may believe that both your landing page and one of your later upsells could use some improvement.  Based on some assumptions and running some numbers, you might find that if you could increase the front-end conversion rate from 3% to 3.1%, that change would have the same impact as tripling your conversion rate on the upsells from 1% to 3%.

But with some business context, you might also know that the upsell is a hard sell at this point – maybe it’s really expensive or maybe the offer just isn’t compelling as it needs to be.  Not to mention, a later upsell requires more traffic to get the test to statistical significance.  As such, that little bit of math you do might help you move forward with the front-end test instead of some lengthy upsell one.

Too many people miss this prioritization step and as a result, don’t focus on the key points of leverage in their business.

So… ready for the 6 category process? We’re about to get into it. But first a word to the wise…

The below is fairly in-depth and so it might serve to identify where you ASPIRE to be.  You may not have these things in place now or in a year.  Don’t be intimidated.   If you’re at the beginning of your journey, pick one or two of these gaps and close them.  When your business is young, even the smallest changes can have a tremendous impact.

If you have a mature business but are looking to take it to the next level, you’ll want to address more of these gaps or hire someone to get it done.

Ready? Let’s go.

6 Revenue-Focused Categories

The list below is by no means perfect, nor comprehensive across all businesses.

But it does reflect the primary steps in my process of helping to break down a business to find areas to maximize.

The core questions fall into 6 categories that are primarily revenue-focused.  They may also help to define roles and teams as the organization grows.  I’m a huge believer in managing expenses, but if you’re a younger, growing company and you don’t have sales, the rest doesn’t matter:

  1. Traffic / Media
  2. Conversion
  3. Offers
  4. Non-converting leads
  5. Post-Transaction
  6. Retention

Let’s start with…

1. Traffic / Media

Start with your traffic sources.

Do you have a weekly report showing…

  • traffic
  • spend
  • conversions
  • CPA
  • conversion rate
  • AOV (Average Order Value)

…by traffic source (SEO, Facebook, Email, etc.)?  Can you analyze trends weekly?  If not, you’ll likely find that simply reporting on this type of information will provide a foundation upon which to build.

media-report

Then you can starting digging in with a number of questions:

  • Do you know customer LTV by channel?Because performance relative to goal is the only way you can say that one channel is doing better than another.  (I’m assuming you’re a direct-response marketer and not simply focused on impressions and reach.)
  • If the LTV is different, are you actually managing to different CPA goals?
  • Are those different goals on your reporting spreadsheet and are you managing to those different goals?
  • What channels are performing better than others?
  • What sub-channels, ad groups, etc. have shown success and which have struggled?This sounds like the same question, but the former is at the channel level.  This is about looking at results where everything happens — in the details.
  • And then, there’s the simple question of when was the last time you tested new copy or images?

Not all questions will come from a report. For example:

  • How repeatable and scalable is an opportunity or channel you’re considering? You might get pitched what you think is a great idea, but if it’s only a 1-off and you can’t replicate it and scale it, you might want to consider passing.  For example, someone with a list offers you a JV deal, but you need to do a ton of customization on your site and to your backend to run it.  And that customization isn’t applicable to other JV partners.  That takes work and is a potential distraction to your team who might be able to focus on other opportunities that are repeatable and scalable.   This is not to say you never do 1-off’s, but rather that you look at these types of opportunities with a discerning and intentional eye.

In general, in my experience, the companies that have had the greatest success know that repeatability and scalability are two keys to their success. And those companies know…

The one big mistake to avoid.

And this applies beyond media.  Once you find success with a channel (or offer), go deep and hard on it.  It’s really easy to get so caught up in testing different sources that you fail to fully exploit one (or two) that is working.  Or like a lot of marketers, you might have shiny object syndrome or get captivated by something you hear from a friend.

If you look at the successful marketers out there, they aren’t actually masters of every channel.  They are usually really good at one or two.  When you think about it, that’s not surprising.  They probably tested a few things, found some success and then pushed hard there. Because they knew that they couldn’t be great at everything but also that they needed to go deep where they were having success.

Sometimes that’s the difference between those who scale and those who don’t.  Two companies might both achieve early success but it’s what they do with that success that can separate them.

Key Takeaways

  • Work to understand the value of customers from different channels and that you’re managing to those respective goals.
  • Filter on repeatable and scalable opportunities.
  • Once you find success, exploit the heck out of it.

Next up…

2. Conversion

Most people have the raw basics down:

  • Click through rate
  • Overall conversion rate
  • Average order value

Then you can starting digging 1, 2, or even 3 levels deeper with a number of questions:

  • Do you know conversion rate by traffic channel?
  • If you have a 2-step conversion path (landing page -> checkout page->thank you page), do you know the click through rate from landing page to checkout page and from checkout page to thank you page? It might reveal something to you, such as break points in your funnel. Translate this to other parts of your funnel and your business.
  • Can you betterunderstand the different steps in your business? For example, do you track how many people submit an email address or a credit card on your form but don’t complete an order?  This might tell you something about your form, page, offer, or something else.
  • What is the take rate for each upsell in your funnel? Do you know it overall and by channel?
  • When you calculate AOV, are you including continuities initiated from that first transaction when you consider Lifetime Value? Meaning, when you analyze initial orders, are you appropriately valuing them(while understanding there are cash flow implications to consider)?

I know… I just hit you with a ton of questions. Take a deep breath.

Then, just pick one of them and focus. Or, hand that list to whoever handles conversions and allow them to pick. I’m intentionally throwing a bunch out there to give you different ways of looking at your conversion path.

Then, there’s the most underused and valuable conversion tool that digital marketers fail to add to their mix:

…a phone number.

But isn’t the phone old-school technology? Yes, it is.  But you also might not realize that many marketers make 25% or more on a phone order than an order online (even factoring in the cost of talk time and agent costs), not to mention conversion rates can be dramatically higher on the phone.

So if a customer has a question or wants to order on the phone, do you let them?  Particularly if you have customers 45+ years old or have a higher ticket offer?

Even if the idea of managing a call center scares you, you can do a simple 3-step test:

  1. Get a new prepaid mobile phone number for your business
  2. Put that phone number on the landing page AND checkout page
  3. You or one of your team can answer calls – even if you only want to answer calls 5 hours a day, put a voicemail message for when you don’t answer.

You will quickly figure out if people want to call, then you can see for yourself if the added work of more numbers, agents, or even a sales call center (VERY different than your customer care agents) is worth it.

Key Takeaways

Whether you’re sending your traffic to a…

  • landing page
  • phone number
  • webinar
  • Amazon
  • physical store

…try to break down and track the process each step of the way.

At the least, you’ll have a baseline to measure from.

Better yet, once you break things down at a more granular level, you’ll uncover opportunities you hadn’t seen before.

3. Offers

There is plenty of info out there Tripwireswriting copy, etc., so I’ll focus on a couple other areas that can have a significant impact on your business.

Upsells

Anything less than 2 and you’re probably leaving money on the table.

Giving customers the ability to order more than 1 of whatever you offer — 2 or 5 or 10 of something — is an upsell.  They don’t have to be some magical new product.  While ingestibles have had real success offering multiple units, if you offer a training program, why not suggest that a customer buys a second for a friend, or gets a second for a discount?

Offer Bumps

Russell Brunson has a really slick version in Step 2 of his process here.

offer-bump

Don’t have another product to sell?  Be an affiliate to a relevant and complementary product…

  • If you are in weight loss, go partner with a company like HealthyOut or a food delivery company
  • If you’re in the dating niche, find someone who can help your clients with personal style and attire
  • If you teach internet marketing skills, find a technology partner (look at what Digital Marketer has done with InfusionSoft)

Then, when you test, you can see what your traffic responds to, and that might give you some insight into what product your audience will respond to.

Installment Billing and Payment Plans

Some marketers offer a premium for installment billing — the multi-pay total is actually more than the 1-pay.

(By the way, this is also called financing and what each of us did when we bought a car or a house.)

Some marketers (see: infomercials) start with a multi-pay offer and then offer an incentive for 1-pay (managing to bad debt and getting cash on day 1 can be hugely valuable).

Neither is right or wrong. Or inherently good or bad. But are you doing either?

Price Testing

When was the last time you tested increasing or decreasing your price point?

You can test by traffic or adding/removing something simple in the offer in case you’re worried about customer backlash — test to a small percentage of your traffic, but you need to get at least 500-1000 orders to feel good about the results.

Key Takeaways

What can you do to generate more?

When all else fails, go check out what your competitors are doing!

4. Non-converting Leads

The average conversion rate to most sites is ~5%.  That means 95% of visitors aren’t converting.

Which means it’s absolutely necessary to be using retargeting. Are you?

On Facebook?

Here’s what a retargeting ad looks like on Facebook…

fb-retargeting-ad

Display?

Via email for cart abandoners?

Test when and how many to send – perhaps start with 3 emails – 20 mins post-exit, 23 hours later, and then 1 week later.

cart-abandon1email-confirm2

You can dig in to your retargeting efforts with these questions…

  • When was the last time you tested your creative on retargeting?
  • What can you apply from your retargeting campaigns to cold traffic.For example, lookalike audiences on Facebook or Google?
  • If you have a higher price point product (over $500 for example),have you tested calling non-converting leads?  (There are some specific legal rules on calling people, so take a look at the rules before doing so.)
  • When was the last time you had someone go through your site to make sure that pixels are actually in all the places you thought they were? Or whether your remarketing automation is actually working as you believe it to be?

Key Takeaways

Don’t let anyone go.

Even junk traffic can be monetized — I know a guy making a killing by taking people who mis-dial toll-free numbers and offering them a survey which has been funded by a research company.  Don’t harass people, but even people who inadvertently raised their hand can be valuable.

Regardless, definitely make sure you have a path for people who don’t convert.

5. Post-Transaction

Again, there is a lot out there about offering more on the thank you page.

So let’s target other areas of your business

Do you send an order confirmation email?

Do you offer content or additional offers in that confirmation email?

orderconfirm1shipconfirm2

What about a shipping confirmation email?

order-confirm

Do you provide onboarding content?

Here are some great examples for SaaS businesses, but applicable to any business.

This one frankly could come pre-transaction but do you make it super easy to get going with something as obvious as a “Start Here” button

start-here

Do you tell your customers what to expect when using your product?

  • If you offer a cleanse, do you tell customers to be prepared to be cranky on day 3 or 4, so that they might want to start on a Thursday so their work doesn’t suffer?
  • If you sell them an ingestible, like a shake, do you provide recipes and/or make suggestions on how to make it a part of their daily routine?
  • Do customers know to expect that muscle soreness doesn’t usually kick on the next day but 2 days after (because of DOMSS – Delayed Onset of Muscular Stiffness and Soreness)
  • On day 30, if they purchased an ingestible like protein powder, do you send them an email with a quick reorder link?

Is it easy for people to find answers to questions or know where to go or do you try to make it nearly impossible for customers to contact you?

And in that case — are questions responded to in a timely manner?

Key Takeaways

Most of these suggestions don’t immediately impact your bottom line.  But if you can take steps to make sure that people’s experience of your product or service is great, and that they feel like you are looking out for them, they will like you that much better.

And their chances of success with your product will be higher.

Which means repeat and referral business.  (This is the cheapest source of traffic you can get.)

6. Retention

Note: This section is applicable both to continuity offers (e.g. membership sites, subscriptions, etc) and “1-time” transactions

Let’s start with a few questions here:

  • Especially if you have a continuity or subscription-based business, do you have a single person accountable for retention?If the answer is everybody or nobody, that may be the first place to start.

Well beyond retention, having a single person accountable for a component of the business increases the chances of it improving, or the rate by which it improves. And simply because there’s a single person accountable doesn’t of course mean that individual is the only one working on it. It merely means that they are the owner who then coordinates with other folks on the team.

That individual could then focus on understanding and improving questions like the following:

  • How long do customers stay on continuity? By channel or offer?
  • Are you breaking down customers into cohorts based on start month to see if there are any changes over time?

retention-table

  • Do you know your refund rate? Remember that refunds are a part of customer retention, even if you don’t have a continuity product.
  • What are the top 3 reasons people cancel or return your product/service?
  • What do your customer service reps say when a customer wants a refund?  Based on any kind of segmentation?

The above gets you to a baseline level of understanding. Again, don’t get too caught up if you don’t have this historically – at the least, beginning the process of tracking sets you up going forward.  The next step is to see what you are actively doing to extend the lifetime of a customer.

  • Can the messaging on the front-end be tweaked, without killing conversion?
  • What content should be communicated to the customer after they have purchased?  (Overlaps with the post-transaction section above.)
  • Can you partner with someone to offer a product or service that addresses the bigger challenges people face?

One of my friends has a product to help people build their own business, but he knows that one of the biggest challenges his customers face is psychological, not technical.  So he has partnered with a personal development coach offering his services to his customers as an upsell.  He can also test offering these services, potentially for free, given how high his price point is, to customers wanting a refund.

“Before you cancel, can I connect you with a personal development coach who will spend 45 minutes with you to help get you over the barriers that have been holding you back?”

That’s a pretty compelling message.

  • Can you keep people on a downgraded plan when they want to cancel?

When I tried to cancel my ClickFunnels account, which was $97 / month, I got an offer for $19 /month (I think) to keep pages but they aren’t live.  But if I cancelled, my pages were deleted forever.  So I’m paying to pause my account.

That’s pretty slick!

Here’s a question I’m sure more than a few of you are asking right about now:

What if you don’t have a subscription model? 

(Other than the snarky, “well you should get into one…”)

Retention doesn’t have to be about continuity billings but can be about making sure someone is active and/or happy enough to buy when you put out new offers.

Ultimately, what can you do to create happy and successful customers?  It sounds so obvious, and yet too often we fail to dig in to understand our customers’ key pain points – just spend a couple hours taking customer care calls and you’ll hear it first-hand.  Then figure out how to take that knowledge to tweak your customer’s experience.

Key Takeaways

No matter what, your business shouldn’t be just about traffic and acquisition.

As everyone knows, it’s a lot easier to sell to an existing customer than to a new one.  So what can you do to nurture your existing ones?

So here we are…

This process really is about identifying and digging in to the key components of your business.  Whether you’re a 1-person shop or have teams all over the place, the actual process of going through and answering these questions – at least for the first time – will likely identify gaps as well as needs (oftentimes information needs).

But the process doesn’t stop after that first time.  It should build to be a continual process that eventually gets parsed out to team members who have accountability for improving their respective areas.

Final note: everyone is resource-constrained, so you’ll want to find the biggest points of leverage in your business.  But don’t shy away from small wins.  Remember, a lotta littles can add up.  When you and your team start paying attention to the more granular details in your business, that is when you will create true optimization and scale.

So at the very least, pick a single area to focus on.  Make it something achievable.  And go make it happen!

I’d love to hear your thoughts on where you have challenges driving growth and where you’ve had particular success.

(This post originally appeared on the DigitalMarketer blog.)

The Most Important and Powerful Model for All (Direct Response) Marketers

If you’re running paid media of any sort (Facebook, TV, affiliates, direct mail, or otherwise), you have to understand one thing above everything else: the value of a customer. It is crucial to help you manage media. The lesser-considered discussed but equally important benefit of having a customer LTV model is that it helps to identify key points of leverage in your business and where to direct resources for testing and optimizing.

In this video, I walk through the customer LTV model (aka, the margin model or the unit economics model). Regardless of your understanding and use of the model, my goal is that you will learn something new and approach it in at least a slightly different way than before.

As always, please let me know if you have any questions or comments.

A Proven Framework for Optimizing a Subscription Business

This is not a “how to start a subscription business from scratch” piece.  If you want to know the first 3 things you should do, stop here.  That’s not what you’re going to find.

This piece is intended for marketers with at least $5 million of annualized revenues, and certainly those into 9 figures.  There are plenty of resources on getting started. My expertise is in optimization and scale.  In bringing together analytics to drive actionable marketing insights for subscription businesses, whether a subscription box business, SAAS service, or another type of recurring revenue model.

Feel free to call this a process or a framework, but at its core, it’s about taking apart the business to ensure that the key components and levers are understood.  And then in putting resources in areas that will provide the biggest bang for the buck.

The fact that the list below looks like a step-by-step process is a bit misleading because you don’t wait until one stage is done to move on to the next.  Similarly, if you move on to the next, it doesn’t mean that the prior stage is “done.”

I’ll provide a bit of rationale for the sequencing, and then specific and deeper insights into each.

Here’s the sequence I use when helping those with subscriptions and recurring revenues:

  1. Retention
  2. Build Customer LTV Model
  3. Evaluate media
  4. Funnel reporting and testing
  5. The value of being a member / customer journey mapping
  6. Email
  7. Social / Content
  8. Operational improvements

If you’re in the TL:DR camp, here’s a brief summary of the steps with a much more extensive write-up on each.

The first thing to make sure is well-understood (regardless of how optimized or not it is) is the value and lifetime of a customer.  What’s the average stick rate and cancel rate of a customer and how does that vary by traffic source, partner, plan/SKU, etc?

Armed with that info, building the customer LTV/unit economics model is a natural next step.  The first step helps to understand how long customers stay around, the second step is about rolling in day 0 revenues and the cost structure to get to a gross margin value per customer.  As I mentioned earlier, getting to step 2 hopefully clearly doesn’t mean that the work on retention is done.  Understanding churn, why people cancel, particular drop-off points in the lifecycle, as well as a sensibility around the various touchpoints that can affect retention, means the beginning of a bunch of work in improving the business. More below on this point.

Once the value of a customer is known, whether in aggregate or by traffic source, it makes sense to (re)-evaluate paid media.  Hopefully, there was a reasonable sense of the value of a customer and target CPA prior to this process, but undoubtedly this framework helps to improve model assumptions as well as inspiring a revisit of how paid media has been managed.  Note that I’m grouping together all media – whether Facebook, Google, or TV on the true paid side, as well as any affiliate and influencer campaigns you may have running.

From there it’s about funnel reporting and a testing plan.  What happens when customers hit your site – what percent of them convert, what’s the average order value, what happens to those who don’t convert?  These are only a few of the necessary metrics to understand and then to test to improve.

At this point, I’ve found that it makes sense to build a customer journey map.  Whether in a simple file like this one, or as a beautiful graphic, the point is to make sure you and your team keep in mind the state (mental and emotional) your customer is in, and then how your goals compare to those of your customer.

I’m the first to say that this type of work hasn’t come naturally to me, but it’s not simply a feel-good exercise.  It should absolutely drive action.  If it doesn’t then scrap it.

From there, dig into the email campaigns, which arguably should have a significant impact on your company’s bottom line.  Remember that many customers who come from paid traffic don’t convert right away – they need to learn more about the business, the brand and otherwise.  Email is a crucial part of keeping them warms, sending offers, etc.  It’s also typically where a lot of the conversions that happen on a last click basis end up being driven.

I have a feeling that some folks may think this next section should come first, not #7 on the list. If you’re a startup, then social and content may be one of the first things you focus on.  I put organic social and content here because they are important, but for most companies with some semblance of scale, not to the extent the prior areas are.  They might’ve gotten you to this place, but as the business has grown, those prior steps becoming increasingly important to get dialed in.  That being said, I know folks who drive a ton of traffic because of the content they create.  Or others with massive engagement on their social platforms.  Putting attention on owned and earned media is a big deal.  As is building a community around your brand.  That’s a bit of what these two can do.

Finally, concurrent with this framework is work that happens on the more operational side of the business.  Working to improve the product and making operational improvements (warehouse, customer support, etc.) can and should be happening on a regular basis.

Now, Digging Deeper

  1. Retention, Cancels, Churn, & Lifetime Revenues

Regardless of the category in which you play, if you’re in the subscription business, these are some of the most important metrics to understand.

I like breaking down retention by cohorts – essentially grouping customers – by their join month at the simplest level, and then ideally by traffic source, the offer or plan they took, and any other ways you might group customers.  Within traffic source, you can of course break things down to varying levels of granularity; I would just be careful about the volume of data you have to make sure that any analysis you or someone on your team does is statistically significant.  Meaning, you might break down Facebook into not just Ad Sets but specific ads within those Ad Sets, or you might look at specific affiliate traffic.  But if you only have 20 new customers from those more granular views, then the difference of 2-3 customers can have a meaningful impact on your percentage calcs and as such, shouldn’t be trusted.

Here’s are 2 views I’ve created for a client:

For a business where the vast majority of customers are on the same frequency of renewing their subscription – whether a Netflix subscription where the concept of pausing is very much the exception or Proactiv which similarly has the majority of customers on “regular” shipment frequencies – this view is the one to start with.  I’ll provide the contrast just below.

The core here is to group customers by join month and then to look at the percent of customers who remain at each billing cycle.  The calc can be based on the percent of customers billed and/or the percent of customers who haven’t cancelled.  There’s nuance to each.  That’s why this view is more relevant for businesses where customers are on a regular cadence.  If you’re a Netflix customer and you don’t pay, then you lose access to the service, so the those who have been billed and those who haven’t cancelled (or been cancelled) is pretty much the same thing.

An important note, yours might be a quarterly billing cycle, so cycle 2 may mean 90 days out from their original purchase, as opposed to the cycle for Netflix would be monthly.  I just want to make sure it’s clear that Cycle doesn’t always equal Monthly.

We’ll talk in a moment about interpreting these tables, but I want to make sure the basics of what’s here are clear.  The filters at the top might allow you to segment customers by traffic source (FB vs. Google, or TV vs. direct mail, etc.), by initial offer (a 30-day sample vs. a 90-day sample), or campaign (this might be a promo code or special offer).  I’ve just picked a few here.  You might include sales rep to the extent that’s relevant, the type of lead they are, or the tier of plan a customer chooses.

This next view is a shipment-based one.

Since many subscription box companies allow you to pause your next shipment, looking at the percent of customers who haven’t cancelled may not give you a sense of the real value you’re getting.  If you’re a Blue Apron customer and you’ve paused your account, you aren’t cancelled, but you also aren’t active.  I know this sounds detailed and subtle, but trust me when I say these distinctions can affect how you perceive retention and customer value.

As such, this view is based on the percent of a cohort that has received shipment x, regardless of whether that was in month x or 3 months after the “normal” time.  Clearly, this has an impact on your P&L and on cash, and you have to do some of that reconciliation.  But it also does help to normalize the analysis around cohorts.

I’ve included the same filters here – clearly, those would be customized to your business as they were in the first example.


How You Can Use These Tables

For starters, they give you a clearer sense of how long customers stick around – whether x number of billing cycles, months, or shipments.  Particularly if you’re out raising money, investors want to know how long the average lifetime is.  You and your team need to know these metrics.

One of the biggest reasons that reports are important is that they help to reveal differences and changes.  How do customers from one cohort compare to another at similar periods? How does the value of a customer differ from one traffic source versus another? Does one sale rep deliver much higher value clients than the rest?

Other questions to consider:

Do you lose more customers at certain points in the lifecycle? Most trial businesses lose 30% of their customers during the trial period, for example, but might only lose another 15% in the next cycle after the trial.  But for some reason it might jump to 25% in the following cycle.  This helps to identify where something might be breaking, where customers are no longer engaged, where your team is dropping the ball, etc.  Then it’s a matter of putting time and attention towards these issues.  To state the potentially obvious, the earlier in their lifecycle the better.  It’ll have a trickle effect downstream, but there may be some quick wins you have for slightly more tenured customers that you can affect.  I detail some tactics you can use here.

-In that above piece, I speak to making sure you understand the reasons customers are cancelling.  For most subscription businesses, these typically fall under:

  • Too expensive/don’t see the value
  • Don’t use it
  • Doesn’t work / Don’t like the quality
  • I’m travelling / moving
  • Your customer service sucks and can’t help me fix problems
  • Delivery issues

Depending on the volume within your buckets, that can help determine prioritization.  And help inform ways to address.  Delivery issues and customer service are operational issues.  If someone cancels because they are travelling, you might add a “pause” feature – or at least tag these customers so that you remarket to them after 30 or 60 days.  The top 3 on that list are common and can be issues around marketing, product, follow-up, messaging, etc.  Sometimes your pricing is off, maybe your product just isn’t that good, and then the reality is that customers leave.  Ramit Sethi wrote a great piece speaking to this point.

What does the cancel curve look like? Of those who cancel, when do they do so? Are there a bunch of people cancelling on day 0 – so maybe they’re gaming a trial or promo? Or on the day you send notifications about their next shipment (which is pretty common)? Or on the day or two after the next cycle (which means they may not have wanted it and may even be asking for a refund)?

One of the reasons the cancel curve is important not just to understand but to monitor on an ongoing basis is that it can serve as an early indicator of something that has changed.  The retention analyses above are crucial, but they can be lagging indicators and analyses around critical business issues.

Look at the chart below:

Note how the cancels in the first 7 days jump from ~4% from Feb-May to 11% in the month of June? That type of behavior will show up in the retention analysis when you do it at the beginning of July, but a) it’s not uncommon to overlook the most recent month, if only because you just have less time and data; and b) those extra days between when an issue pops up, you identify it, and then figure how to fix them are costly.  If you knew you weren’t billing 10% of your customers each month, you’d want to know that as quickly as possible, right? Well, of course cancels mean fewer billings.

In this case, something had changed both with the buyer email sequence, suggesting to customers that they needed to take action when in fact they didn’t (an oversight), and with an in-box insert suggesting the same thing.  Both decisions had been intentional, but obviously the impact wasn’t.  The email was easy to fix; the insert meant getting more printed and then sent to swap out at the fulfillment centers.

Lifetime Revenues

In a nutshell, the above KPI’s have not included any discussion of revenues explicitly.  Sure, revenues are components of retention, cancels, etc. But it’s important to look at these things both in the context of counts as well as revenues.

Certain segments of customers may have similar retention rates but different lifetime revenues.  Depending on the offer, plan, tier, etc., those would be more obvious.  At the same time, some customers may tack on more to their order, whether with additional recurring offers, features, or even 1-time offers.

Regardless, as obvious as it may sound, sometimes we can get so caught up in the above analysis that is based on counts that you forget to layer in actual revenues.  To start, you might find it’s necessary to assume an average order value for all customers, but over time, just as the different filters were put in above, being able to pull in revenues for all customers is just as important.

As we wrap this section, I’ll state the obvious – this was a long and meaty section.  But in the world of subscriptions, these are some of the crucial aspects to put attention to.  Having someone dedicated to owning this part, and then working with others on the team to execute tests and changes, gives you a greater chance of knowing what’s happening in your business and making meaningful changes to it.

As I mentioned early, moving to the next step doesn’t mean step 1 is done.  None of these are ever “done.”  Rather, step 2, building the unit economics model, is a natural extension to step 1.

  1. The Unit Economics Model

I’ve written about the importance of knowing the value of your customer and having a robust unit economics model numerous times. I walk thru the actual model here and go over some additional basics here .

I’ll hit only the key points now:

  1. There are 2 primary reasons you need to understand customer LTV and your unit economics model:
    1. To manage your media. If you’re running paid media of any form and don’t know the value of a customer, you’re headed for trouble. You need to know how much you generate from a customer, what your goals are (% margin, breakeven by a certain day, etc.), and then that helps you back into your target CPA.
    2. To identify the key levers in your model and where to deploy resources for improvement, testing, etc. Knowing your baseline metrics and goals is one thing. Great companies believe that they are never fully-optimized and so have a continual testing program. But everyone is resource-constrained, so knowing where to deploy resources is crucial.
  2. Someone on the team must be accountable for maximizing customer LTV, and as a result, the target CPA. That doesn’t mean they do so at the exclusion of the brand, nor does it mean they do everything on their own. But someone must “own” customer LTV. You’re not going to get better at the pace you want if you don’t do so.
  3. Customer LTV is a combination of revenues AND costs. It’s more fun and sexier to focus on the former. But if you reduce the latter, that goes straight to more dollars you can put to customer acquisition. Here’s are a couple of my posts about optimizing revenues and costs.
  4. G&A, investments, capex, etc. should NOT be a part of your unit economics model. The point of the model is to capture marginal revenues and costs associated with those revenues. You don’t need to hire a new person for each incremental order. Sure, at some point, you do need to make those types of commitments, but that doesn’t mean they should be included in that model.

I cannot overstate how important the unit economics model is to running a performance marketing business.  It should be a living, breathing model that is updated once per month at minimum, and it should help to inform key testing and resource allocation decisions.

  1. Evaluating your media

I felt a little unsure about including this step here, as it should be an ongoing point.  But given the emphasis I place on the Unit Economics Model, it warrants a moment of discussion.

Once you have a target CPA in place – whether overall or by channel – make sure to communicate that to whoever is managing those channels, internally or externally. And to the extent the models and target CPA change, make sure your partners stay up to date.

At the same time, whether you’re managing paid traffic internally or externally, and feel like you have decent scale or not, I believe there should always be a sense of ongoing evaluation of how you’re doing and who’s doing it.  Performance marketing is one of those areas where there should never be a sense of complacency, or really of being content.  Those traits can be a harbinger of reduced performance.

If that sounds stressful, it is meant to be.

Sure, your team and partners should have room to breathe, the time to execute, the resources and support to do their best – whatever that means for your business given the constraints you have.  But as with our own lives, it can be easier to accept the status quo for too long.

Don’t.

Challenge your team.  Challenge your partners.  Have conversations with other marketers.  Keep a decent network of partners or possible full-time people.  The reality is that great people are hard to find, so having this sense of ongoing recruitment, while seemingly time-intensive, can keep you better connected to what’s going on *outside* of your company and keep you connected to good people and partners when you need them.  Because you will need them at some point.

  1.  Funnel reporting and testing

This can sometimes be referred to as Conversion Rate Optimization (“CRO”), but I don’t like that term because it seems to exclude revenue.  For simplicity purposes in this section, I’m going to assume that traffic is being directed to a website, as opposed to being directed to another response mechanism like the phone. And so to that end, the goal of the site isn’t simply to maximize conversion rate.  It’s to maximize revenue per visitor (again, assuming that your model is transactional on your site – if your site is a lead gen tool whereby sales agents call leads, then you just have to adapt the premise here to your model).

But even maximizing revenue per visitor isn’t correct.

Your goal should be to maximize margin dollars per visitor.

I’ve got a ton in this prior post about 6 revenue-enhancing areas to put attention to.

Funnel optimization is implicit across most of those 6 areas.

But once you have a sense of the retention rate and value of a customer, again, without ignoring those areas, it’s time to put attention to what happens when someone hits your site.  Reporting is critical to get a baseline.  Then start to focus in on the highest trafficked pages on the site, the key leverage points in the funnel, and work to identify where the gaps and opportunities lie.

I’m embarrassed to say it took me so long to get going with heat-mapping tools like Hotjar or CrazyEgg, but they’ve revealed a ton about consumer behavior and have just exposed areas that might’ve been missed.

For example, with a recent client, it was only by using Hotjar that we caught a blind spot in the checkout flow.  A ton of potential customers were clicking on the top nav on the final step of the checkout process.  As much as I’m all about giving customers what they want and allowing them to navigate, we were hurting ourselves by essentially “suggesting” they click away.  Now, there’s also a question about why people were clicking those buttons when they should’ve been ready to close.  We addressed that separately, but in the interim, we changed the top nav to a progression bar – and so instead of giving people their “check out the squirrel” opportunity, we kept them focused on the checkout process and saw a 10% lift in conversion rate.

One disconnect I often see with funnel optimization is a lack of communication between customer support and the retention team with whoever is running front-end tests.  Hearing the reasons that people are contacting customer support and why they are cancelling can be really helpful to inform front-end tests.  Which is another reason I believe in starting this process from the retention analytics side first.  Take what’s already happening, and then beginning your way back upstream.

Another area where I see marketers slip is in thinking the funnel work is done once the customer hits the Buy Button.  But what happens on the Thank You Page, the order confirm email and beyond are just as important.  As is making sure that there is clear accountability within the organization for these parts of the consumer experience.

Whereas some people think the funnel ends once the customer buys, others think onboarding begins after they buy, when in fact the onboarding process begins once the customer engages with you.  To that end, a great site with a ton of free content is UserOnboard.  They do an amazing job not just of showing what others are doing (they are primarily focused on SAAS businesses), they mark-up their screenshots and provide commentary to identify what they think is being done well and where there are areas of opportunity.

The point being, yes, put time and attention towards optimizing the “traditional” funnel from ad through to purchase.  But also be intentional about the path you want to take people down once they have shifted from lead to customer.

  1. The Additional Value of a Customer / Member as well as Customer Journey Mapping

After digging in on analytics, retention, and some core components of customer acquisition, I like to take a step back to revisit the customer journey and how customers think of the business.  We’ll get more tactical after this with email and social/content.  As much as I could argue starting with this, oftentimes getting grounded and into these prior areas is a more natural way to understand and to start optimizing the business.  Then taking some time to look at the business in a more holistic approach can be a good thing.

I’m somewhat stealing the term of “Member” from Robbie Kellman Baxter, who wrote a phenomenal book called “The Membership Economy” – I highly recommend checking it out.

Now of course she didn’t invent the word or concept of a “Member”.  But she has done a great job of helping people shift thinking about customers to members.  Think about it for a moment – isn’t a customer different than a member?

Do your customers think about your business as one they subscribe to, or do they think of themselves as being a member of your business or service?

“I get a subscription box from this company” versus “I’m a member of their program” or “I’m one of their members.”

American Express hasn’t used the “Membership has its privileges” campaign in years, as Robbie points out, but you still have the word “Member” on your card, regardless of what color that card is.  They’ve done a phenomenal job not just of building a loyalty/point program, but in giving their members real value.

Most recently, they partnered with Shoprunner to give all their (AmEx’s) members free 2-day shipping from a variety of online retailers.  AmEx knew it couldn’t do this on their own, and this is one of the big reasons people order from Amazon, but this is a huge tangible benefit of paying for that annual fee, which is still called a “membership fee.”

Ultimately, a member expects a certain type of treatment, expects that you’re taking care of them, giving them value above and beyond what they might’ve signed up for.  Whether you’re a subscription box company or a software provider, what are the ways you can add value and make life easier and better for your customers?  Some of this might take the form of enhancements to the actual product, or it certainly could extend beyond.

Before jumping in to these additional areas, I’d be remiss to not state what I think might be obvious – there are a bunch of things that should be “check-the-box” items, which you just have to nail.

  • Are customers clear about what they are getting?
  • Do they get the necessary information about what they’ve ordered quickly (order and ship confirm emails, for example)
  • Does the product or service match what they were promised?
  • If it’s a physical item, does it show up when they expect to and without delivery problems?
  • Can they easily find information about their account?
  • When they reach out to customer support, do they hear back in a timely manner?

These are the basics, but anyone who has had issues with the above can attest how hard it is to run your business when the basics aren’t being nailed.  So make sure those are being nailed.

I’d also say that the bar continues to be raised about what people expect.  As much as I’ve detailed some additional areas below in which to add value to your customers, increasingly, these are being included in your customers’ “check-the-box” category, even though you might not think of it that way.

Here are some areas and examples which you might utilize to build out your membership program.

Offers

  • Value-added services (0% margin offers for example)
  • Member versions of promos – perhaps in the form of a bonus, an opportunity to get the bonus for a referral, or otherwise
  • Special offers
  • Buy credits at a discount

Outside Offers

  • Gifts/benefits that aren’t explicitly tied to the business’ products

Rewards

  • Loyalty / rewards program – including rewards for longevity and continuous longevity
  • Acknowledgment / member recognition
  • Physical card
  • What are the benefits of a higher-tier status (silver, gold, platinum) – pricing, shipping, concierge service
  • Unexpected surprises

Connection

  • Connect offline / in-person
  • Community
  • Give them opportunities to participate
  • Access – to FB lives, groups, offers, etc

Something else I’ve found helpful – and I’ll admit that this felt too “traditional marketing” when I first started doing it – has been to map the customer journey.

You can see an example of what I mean here – this isn’t a beautiful graphic but it does serve the purpose of illustrating the more traditional steps customer go through (unaware, aware, consideration, purchase), but I’ve also added in a few sections:

  • For a subscription box business, what are the sub-steps for an Active customer?
  • Where does the interaction take place?
  • What are the company goals at each step?
  • What are the customer’s goals at each step?
  • What is the customer’s mental and emotional state at each step?

For example, once an order is placed, it’s normal practice to send an order confirm email. As the marketer, in addition to making sure the customer gets the necessary confirmation, we might want to give them account details, info about our content, give them additional offers, etc.  But generally speaking, the customer wants to know the order went thru and to move on.  That doesn’t mean that some of them aren’t open to buying more, reading your content, etc., but I think it’s helpful to keep in mind that the customer is very likely busy, might be excited or might even be experiencing buyer’s remorse.  And so, understanding that can help to bridge where they are with our goals.

Everything for me is about driving action.  It might seem that this is an exercise that is just “nice to do,” but it should in fact lead to action, lead to changes in how, what and where you communicate with your customers.

And especially if you want to start moving from having customer to members, it’s critical to be mindful about where they are, not just in their customer journey but in their life overall (hint: they are super busy, want stuff done as easily as possible, and want you to be more than 1 step ahead on servicing them even better than you might expect they’d want.)

  1. Email

For some, email feels outdated and unfortunately is ignored.  For others, email represents the source of 30% of their revenues.

Email is a big deal and one of the primary means that marketers use to communicate with their customers, separate from their blog, social or in the product itself (whether as a physical insert or through an app or software).

There are a couple components of analyzing what’s happening with email:

  1. What’s being done to capture emails?
  2. How effectively are they being marketed to?

In terms of email capture, I’m not a big fan of the pop-up 10% discount offer than shows up on so many sites within seconds of hitting a site. I think it’s a crappy customer experience.  That being said, you have to test what works for you.

What I can say is that it’s worth looking at the most trafficked pages on the site to make sure there are at least 2-3 different ways people can opt in – those might include a newsletter sign-up, an optin for a free e-book, and and exit intent pop.

In terms of monetizing the list, most people can get so concerned about unsubscribes that they become too cautious on hitting their list.  That doesn’t mean that each email has to be an offer, but certainly even if it’s primarily a content-based email, there should be some link or subtle offer driving them to your site.

The early-engagement series, both for buyers and prospects, is particularly important.  Most people are the hottest they’ll be for your brand in the first 7-10 days.  So getting in front of them, whether to make sure they get and stay engaged, or to show them the value of your product to get them to purchase, is critical.

I do want to make a small note about the long tail.  I work with a client where more than 60% of their revenues come from customers who’ve opted in more than 30 days ago.  They have a higher-priced service, so it makes sense that people need time.  But this just emphasizes the need to keep (engaged) people on the list, as well as the importance of content and brand.  When customers take longer to convert, it’s even more likely that your brand is going to have an impact on their chance of success.  So, too, will content – more in a moment on content, but keeping using it to keep your email list engaged can have a big difference on your bottom line.

Finally, remember that solid open rates on emails can be 30%.  Just because someone hasn’t opened or clicked on what you thought was a great offer doesn’t mean they aren’t interested. There’s always a component here of playing the numbers.

  1. Social / Content

Social and content are great ways to increase engagement and connection to your brand.  They are also natural ways to provide value-added content to your audience, whether as an acquisition or retention tool.

Content marketing is no longer a buzzword, it’s what people are expecting. And it can be delivered on your site via a blog, thru email, and on social.  And with sites like Problogger, Upwork and Craigslist, it is getting cheaper to source great writers and editors to help craft quality content for your business.

Plus, don’t forget about soliciting user-generated content (“UGC”).  Sometimes you just need to ask for feedback or a video – whether that helps to inform the product or service, or it can be used as content to market with (make sure you get someone’s okay before doing so), taking advantage of content that is educational, inspirational, and/or entertaining is a big plus.

  1. Operational Improvements

I’ve intentionally focused on the marketing side of the business in this piece.

A few words on Product and then a couple more with an additional link on Cost Optimizations.

Product – I cannot emphasize how important product is.  All the marketing, analytics and optimizations are a ton easier and more effective with a solid product.  And just that much harder with a bad one.  SAAS businesses seem to have a culture of continual improvement, in the form of releases, but many in the physical products world rarely have that culture as a core part of the business.  If you’re in this world, I’d suggest taking a cue from SAAS businesses.

Customers expect that their software or app will constantly be updated.  How many updates have you gotten for your smartphone apps in the past couple of days? Likely a bunch. So why don’t physical products have anything close to that cadence?  Well, for starters, it’s easier to push an update live for software than to do the analogue in the physical world.  And yet that doesn’t mean they aren’t possible.  Please put some attention to do so regardless of your business.

Finally, cost optimizations.

If you’ve made it this far, then I’ll simply suggest you check out this link where I detail some of the core cost-related areas to optimize.

In Summary

Phew, there’s a ton here.  There’s also a ton to your subscription business.  There are a lot of areas to target.  But my final suggestion is to make sure to key in on the main leverage points in your business.  Everyone is resource-constrained so making sure you and your team are focused on the biggest opportunity is crucial.

Hopefully, working your business is a lot of fun.  There are plenty of rough patches and frustrations in any business, but the sheer number of ways you can affect your customer’s experience means there’s never a dull moment and plenty of places to make a difference.

I hope these thoughts help you to improve your business.

And if you have any questions or thoughts, I’d love to hear them.

How Lessons from TV Helped to Scale a Facebook Video Ad Campaign

Watch this case study where I show how the lessons learned from managing DR spots on TV helped us to best exploit and scale a Facebook Video Ad campaign. I break down how we scaled a Facebook Video Ad campaign from $100/day to $12k/day in 3 weeks.

Based on my experience running over a half a billion dollars in media, we knew where to be and what to look for to capture the demand we generated from spending profitably into 20 million views! It also turns out that Facebook Video Ads have a lot more in common with Infomercials than you might think.


10 Ways to Increase Your Subscription Stick Rate

shutterstock_361655879

Whether you think of yourself as a strong or a weak marketer, it’s likely you are not spending enough time working to keep your customers around longer.  Most folks prefer climbing the next peak.

And yet, you’ve heard it a million times.  It’s a ton easier to sell more to an existing customer than to a new one.

In previous posts, I’ve talked about the fact that every business is one way or another in a subscription model.  You either have customers on recurring billing or are “just” trying to sell them again after their initial transaction.

In this post, I want focus on the traditional subscription (continuity) model, where a customer has signed up for a product or service that has a recurring billing component.  That might mean monthly, quarterly or annually.  The point is that every so often, a customer re-ups with you.  That also means that every so often, they have an explicit opportunity to cancel or ask for a refund.

When I work with marketers about increasing their customer LTV and subscription stick rates, the below list details the top places I dig in.  To make sure we understand what is happening at each level, to set a baseline (if necessary) of where they are, and to help inform prioritization of testing to improve that component of the business.

  1. Do you actually know your subscription / continuity take rate and your stick rate on an overall basis?

This is a simple (note, not always “easy”) one.

Sure you can go crazy by splicing and dicing your numbers countless ways.  By cohort. By channel or front-end campaign.  Gross or net of returns.  By customer count and by revs.

But start with the basics. Of the people who start each month, how many are around for the next few billing cycles. Where are the biggest points where customers drop off? Just starting there will reveal a good bit of info and insight to help inform what you should be testing.

For those of you who are already doing so, hopefully I just gave you a few more ways to think about it.  You can always get more sophisticated about how you segment your customers.  And likely you’ll want to do different things for different segments.

But without a base level of understanding of where you’re at, it’s hard to know what to do next.

  1. Do you know the top 4 reasons customers are cancelling or asking for a refund?

Most likely the list includes “too expensive”, “don’t use the product”, etc.  But you might have something totally different on your list, for example that your product is too complicated to use. While no one wants to hear that type of feedback, I’d always rather know that than not.  Because depending on the order of the most prominent reasons, you can decide what to test next and how to tackle each reason.

  1. Do you have a cancel / save offer, script, and training when customers want to cancel?

Next, what do your agents say when a customer calls to cancel? Do they have specific guidelines or an outline to follow? Have you tested (and measured) different strategies? Ultimately, it’s a business decision on what kind of offers you might want to give to a customer.  I’ll say that it drives me crazy when the mobile phone carriers offer me a big discount when I’ve called to cancel.  Why did it take my wanting to cancel to get such a good offer?  For your business, the scripting might include something as simple as probing why a customer is cancelling.  Sometimes there’s a lack of information or training the customer needs.  Whether or not a rep can keep a customer, at the least, that information needs to be documented and passed along to the appropriate person (See #1 above and #10 below).

  1. Do you have customer care agents or sales agents handling cancel / saves?

This is again another business decision, but if you want a true save strategy, I’d suggest that you test your sales agents, not your customer care agents, for this task.  Sales vs. care agents are totally different people.  Both should come from a place of providing value and service to a customer.  But care agents generally have a softer demeanor, while sales agents are typically more skilled at overcoming objections, speaking to features, benefits, and value of an offer.

  1. Does the product actually meet the promise you made when the customer signed up in the first place?

This one sounds obvious, but beyond making sure your product is a good one, this point goes to real expectation matching.  What does your customer actually think your product or service is going to do? Does their experience match that expectation?

Note, beware if you find yourself saying, “well, if only the customer watched the 20 minute tutorial or did x, y, or z, they would know what to do.”  To those folks, I’d ask what guidance are you giving them to watch the tutorial or to know to take the additional action.  At the same time, if your product is touted as “simple to use” and “you can get going in only 5 minutes”, then arguably it shouldn’t take a 20 minute tutorial to do so.   Or if your site is so confusing that customers who are in fact looking for information can’t find it, I’d posit that your “simple” brand promise is not being delivered upon.  Remember it’s not solely about a customer’s explicit use of your product or service.  But rather their entire experience, from order entry to FAQ’s and customer support.

  1. What info do you put on the credit card descriptor?

You may or may not be as anal as your customers, many of whom look through every line of their credit card statement.  Even though your customers may love you, if what shows up on their credit card statement seemingly has no relevance to the brand they interact with, their chances of challenging the charge and/or calling you to cancel will increase.

This kind of thing can happen for different reasons.  Sometimes, a marketer has a business name that differs from the various products she sells.  And so it’s simply easier to put the company name on the descriptor.  This isn’t exclusive to folks intentionally trying to hide their brands from the company name – my guess is that anyone reading this is a purchaser of something from P&G (Proctor and Gamble) but doesn’t explicitly realize that P&G is the parent company.

Take a revisit of what appears on the credit card statement from a brand new customer’s perspective and think about whether or not it would confuse you.

  1. What happens when a customer’s credit card declines?

Do you have a process to retry, use Account Updater, or to possibly call a customer to let them know their credit card has declined? At the least, testing the frequency and overall quantity of retries is something all marketers should do. Whether that means every day for a week or two, or once a week for 4 weeks, the reality is that the cost per attempt is something you or your team should know (let’s say it’s roughly $0.10). Then it’s simply a matter of comparing the necessary success rate vs. your price point and margin.

Account Updater is something I’ve discussed previously, but the short version is that some banks provide a paid service to update the expiration date of a valid card but one that has simply gone past its expiration date.  It’s an extremely rare customer that will call to update their expiration date.  The beauty of the service is that you only pay per successfully-changed card.

Finally, depending on your price point, margin and call center fees, it might be worth exploring calling customers for whom their card has declined.  By the way, one measure of knowing whether you are proud of your product/service or just trying to sneak under the radar on their bill is how you respond when you consider calling a customer.  If your product is actually of true value, then while yes, some customers will take the call as an opportunity to cancel their subscription (how is this worse than the declined credit card by the way?), you should feel a responsibility to make sure your customers have uninterrupted access to your product.

  1. Do you send an email prior to a new billing period and offer additional products?

This might not seem obvious to extending stick rate.  How would notifying people of an upcoming charge and/or offering them more to buy improve retention?  Like many others out there, I’ve signed up for Dollar Shave Club and must say that their pre-shipment emails are some of the best I’ve seen.  Not only am I informed about my next shipment and given the option to delay it, but they have a very slick one-click tool to add additional items to my order, shaving cream for example.  I may not have needed new blades, but if I needed shaving cream, that keeps me on as a customer.  At the least, they’ve added to the customer LTV.  Best case, because I continue to think of myself as a Dollar Shave Club buyer, I’m more likely to keep my subscription active vs. cancelling altogether.  Which either means new acquisition for them or reactivation, neither of which is easier than maintaining an existing customer relationship.

  1. Do you allow customization?

I alluded to this, but it deserves its own call-out.  Increasingly, customers expect to have some level of control on when and what they receive.  We no longer live in the world of one-size-fits-all.  Customers may really like your product but aren’t using it at the pace you suggest.  Or perhaps they have a busy travel schedule for the next month.  Or maybe they use some of your products dramatically more than others (especially relevant for those in the beauty category).  It’s preferable to give people the ability to customize their order online.  But even if you market it online and only your reps can make the change, I would encourage you to test how much flexibility to give your customers.  This is also where using customer feedback and cancelation reasons can help to inform where you start.  If the number one reason people cancel is that they don’t use it (assuming it’s a consumable) as frequently as suggested – beyond revisiting the amount you’re shipping, how you help them consume the product, etc. – you might want to consider varying the quantity or frequency of their orders.

  1. Do you have someone accountable for retention marketing?

Whether you are a solopreneur or running a 9-figure business, if you have a subscription component of your business, someone should be working to improve it.  It might be the difference between getting to the point where you can stop being a solopreneur and can hire someone.  Or it might mean adding even more margin to your business.  Regardless, do the math.  How many people do you add onto a subscription each month?  What’s the stick rate.  How much do you have to move the needle to justify more attention or a hire to improve the value of those customers?  Again, it might be just you for a while.  Or it might just be a no-brainer to bring someone one.  But make sure it’s an informed choice you’re making.

As one of my friends says, there’s never been a more difficult time to acquire a new customer.  And yet, too often we keep focusing on getting new ones at the expense of maintaining our existing ones.  With a bit of process and working at it, there are ways to keeping your customers around and happy a lot longer.  But it requires attention and some testing.

Now it’s a matter of taking this playbook and applying it your business.  The rewards are worth it.